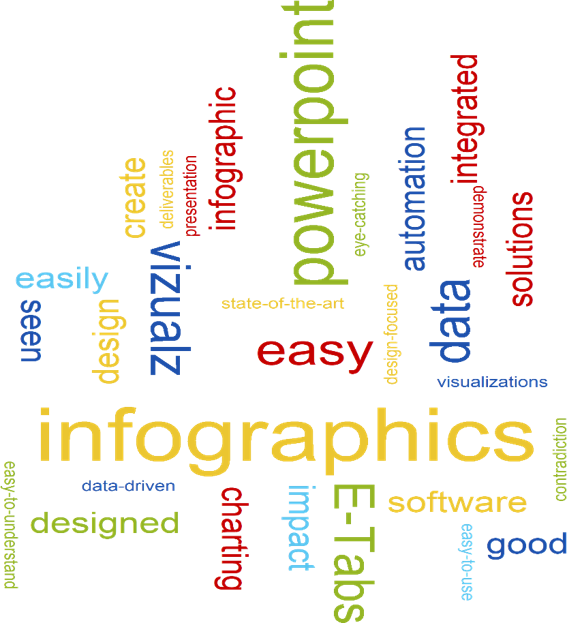
Create meaningful infographics at the click of a button. Vizualz is the only PowerPoint plugin that
enables you to quickly and easily display your data in an eye catching and engaging manner directly
within your PowerPoint slides.
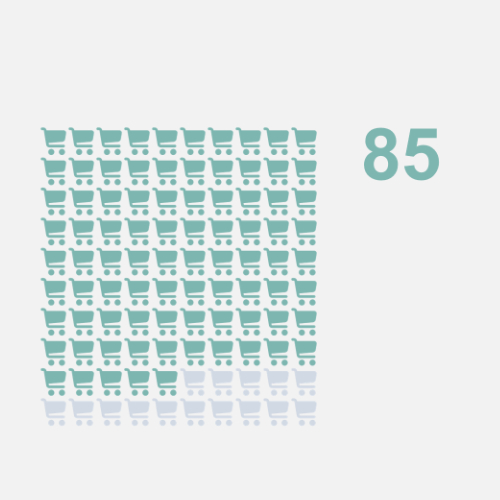
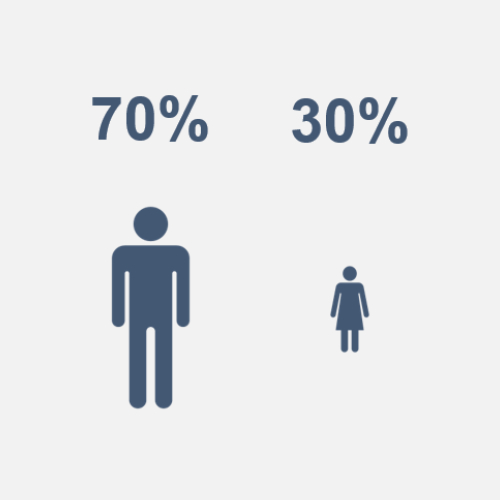
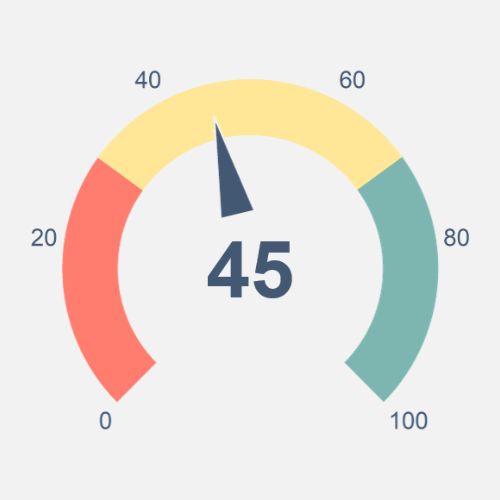
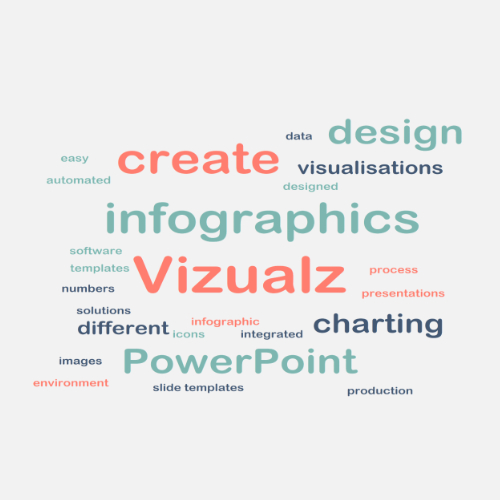
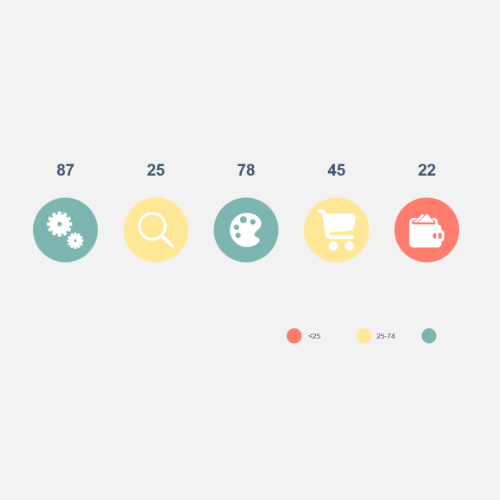
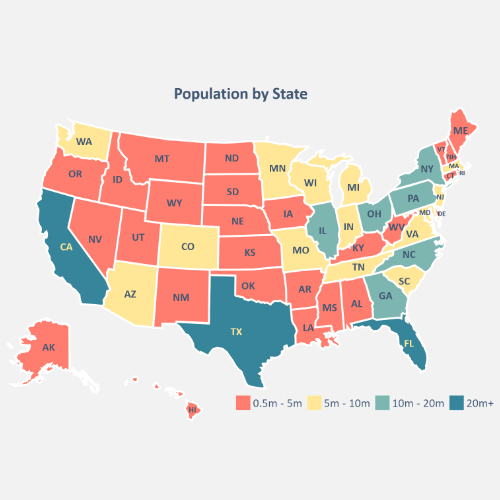
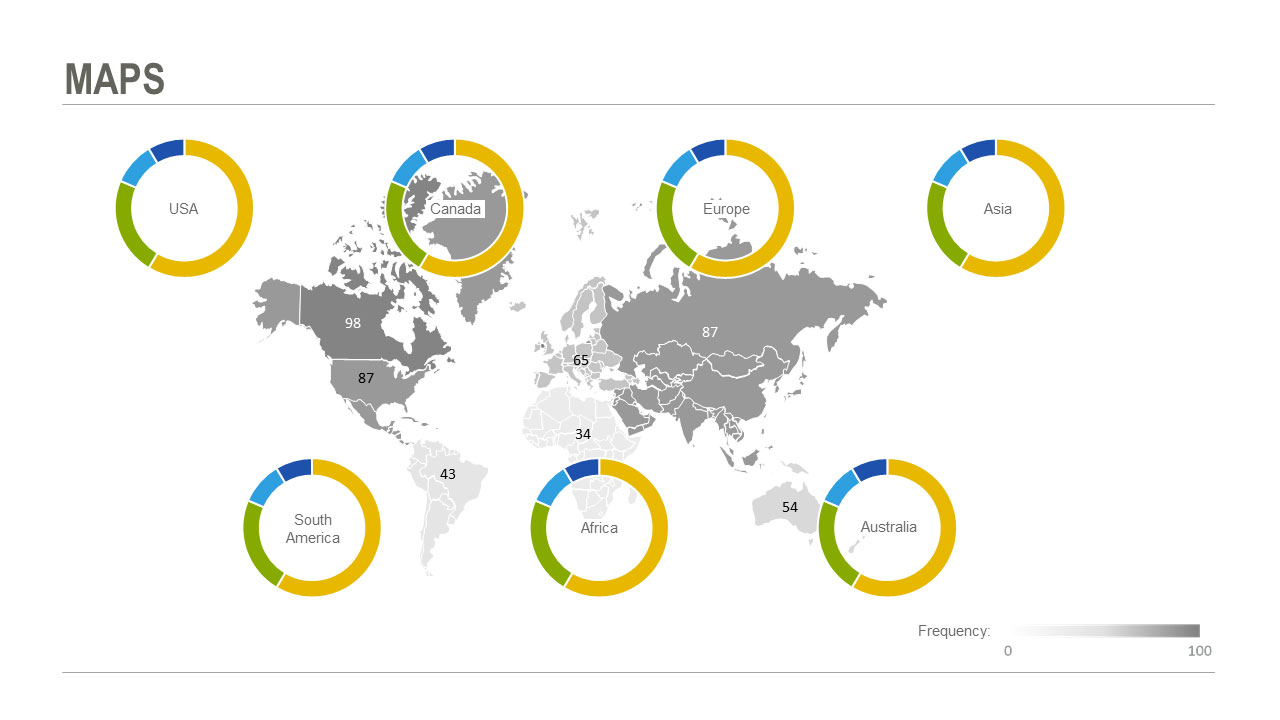
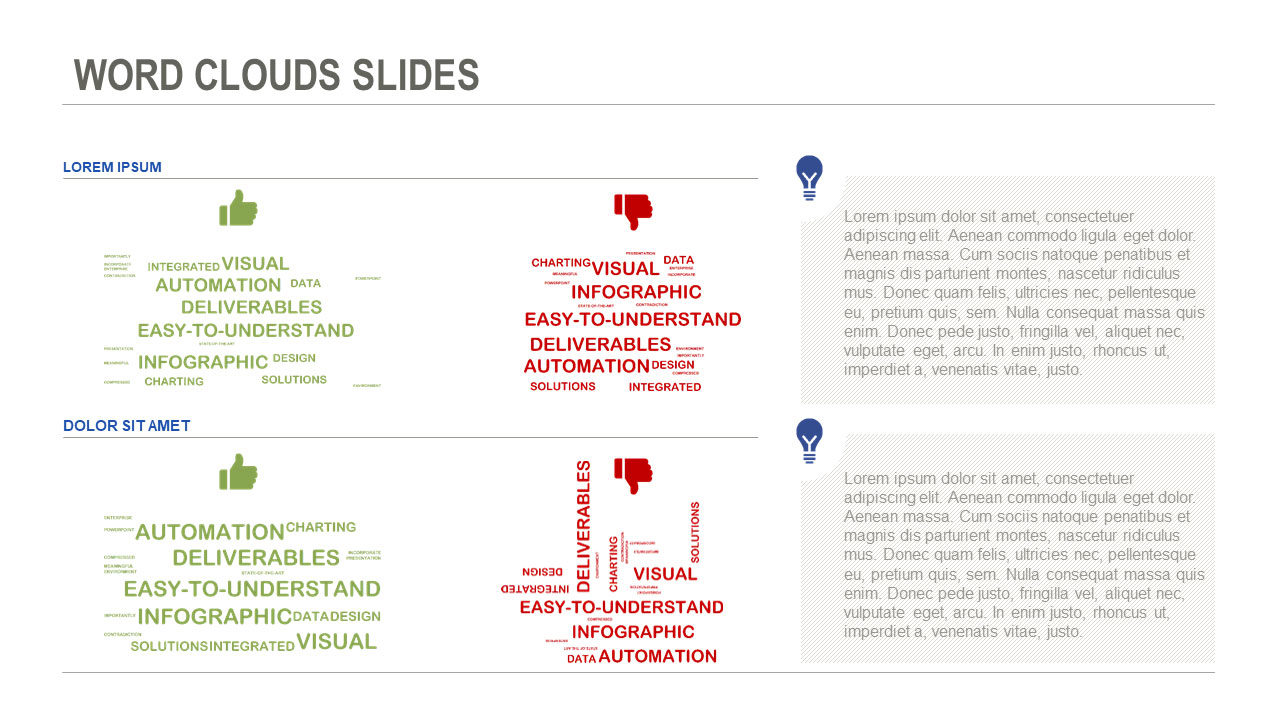
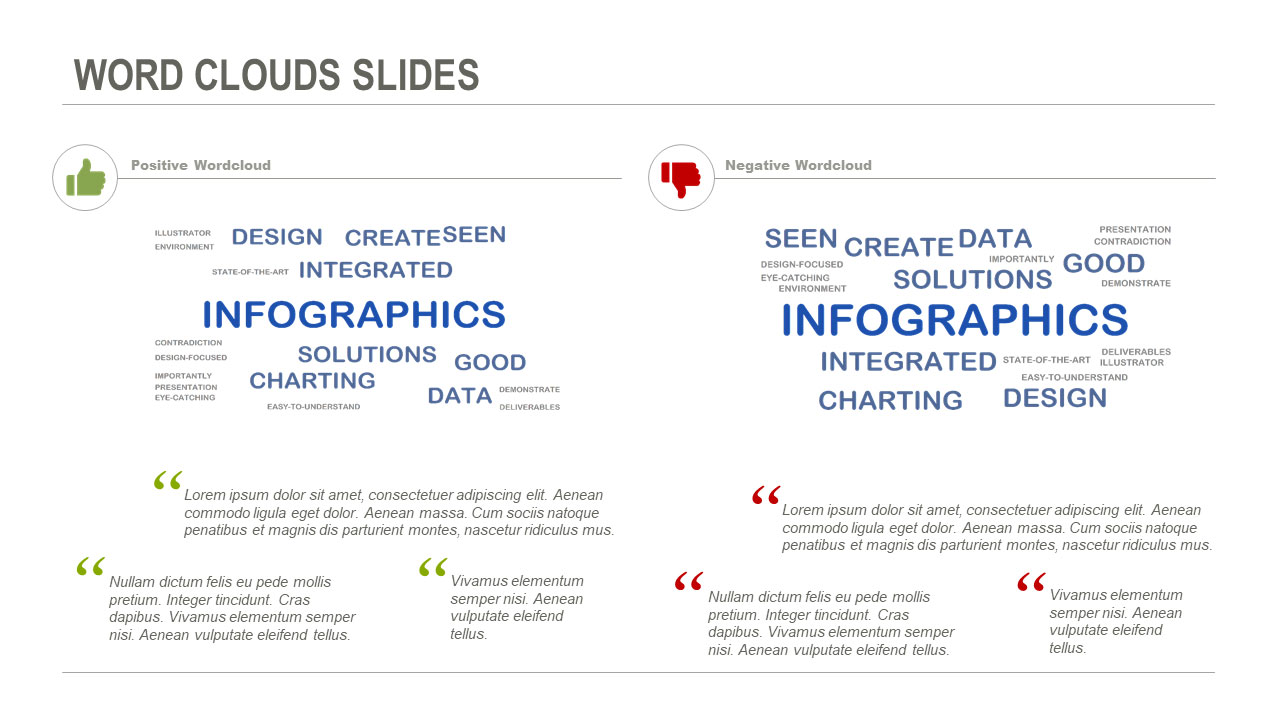
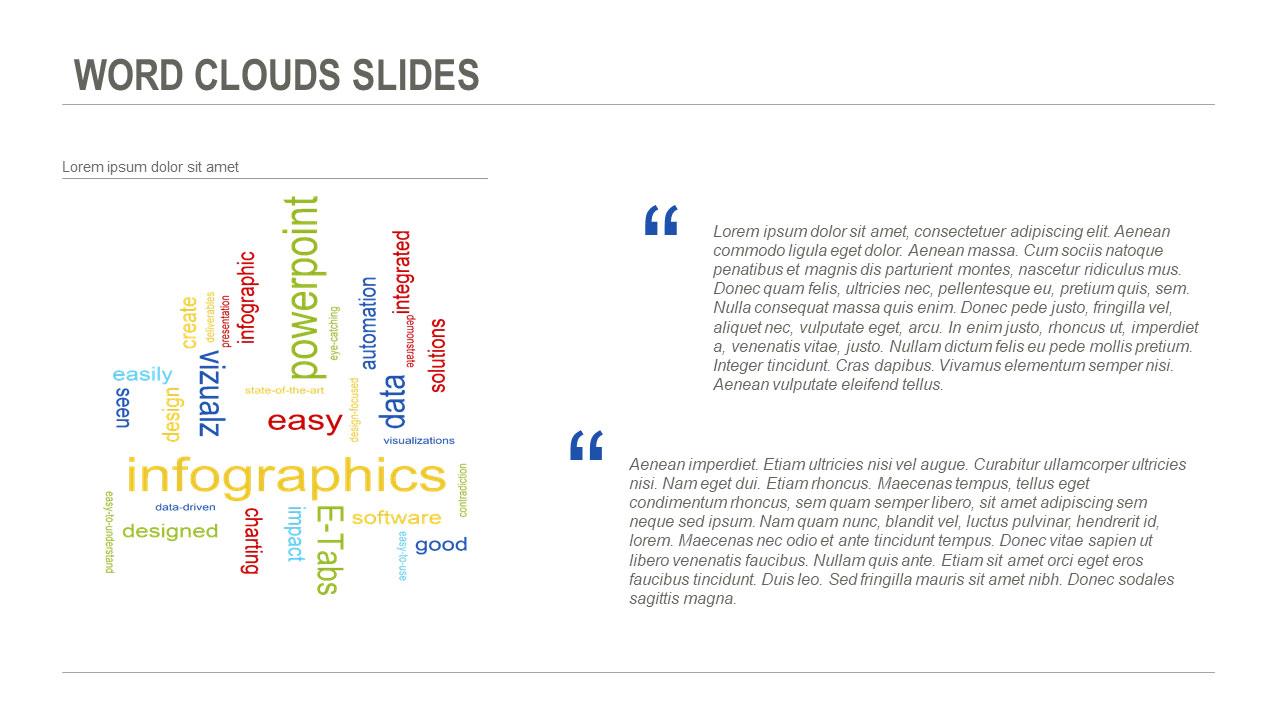
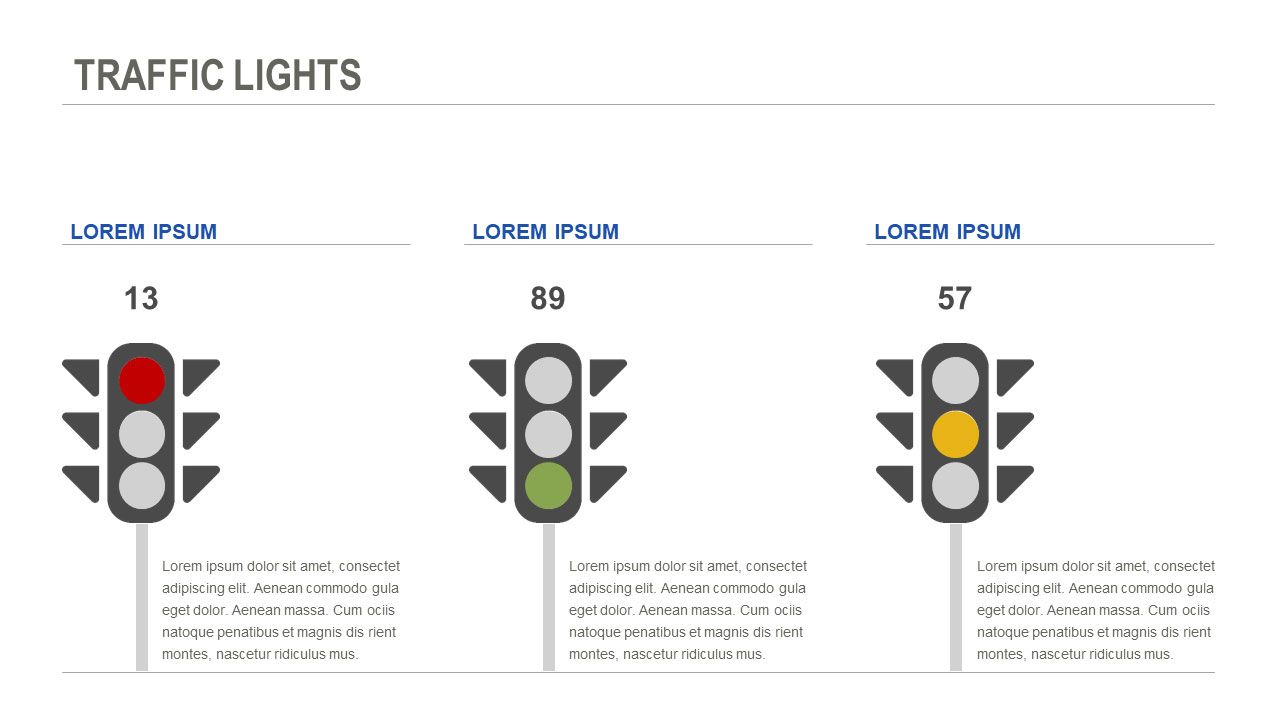
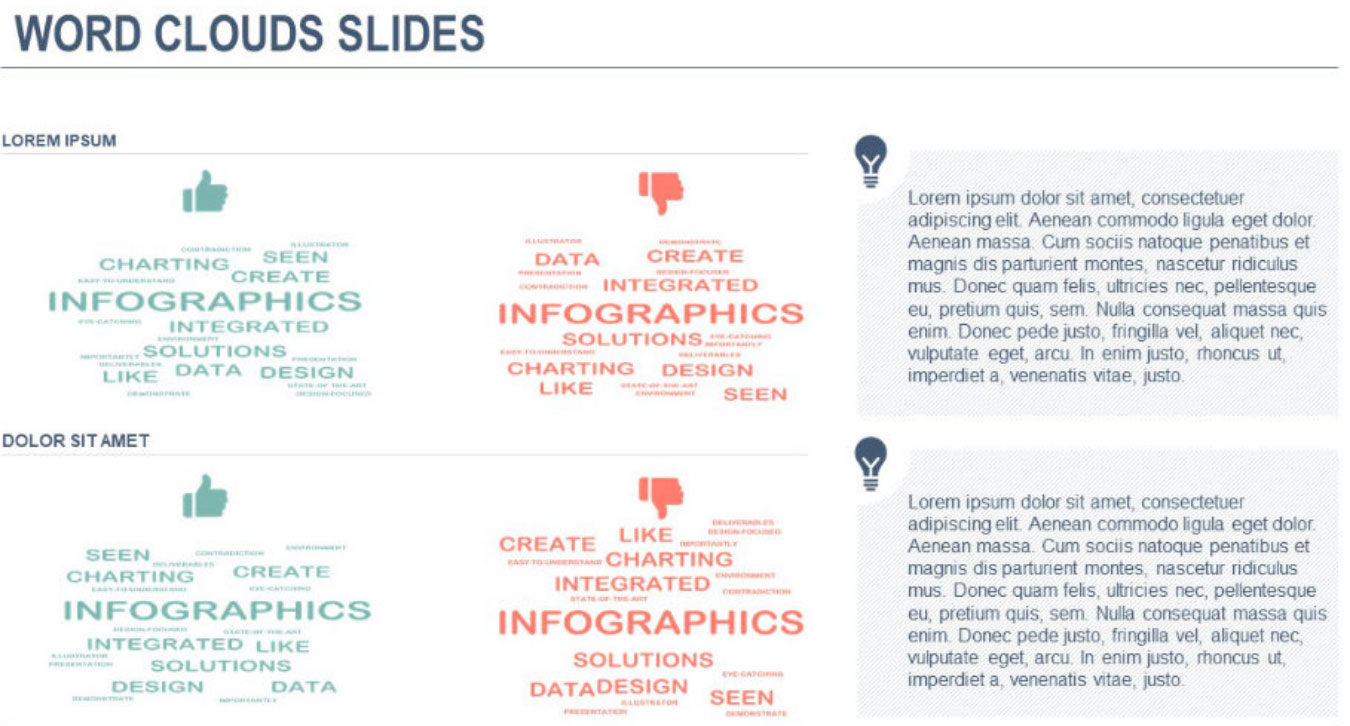
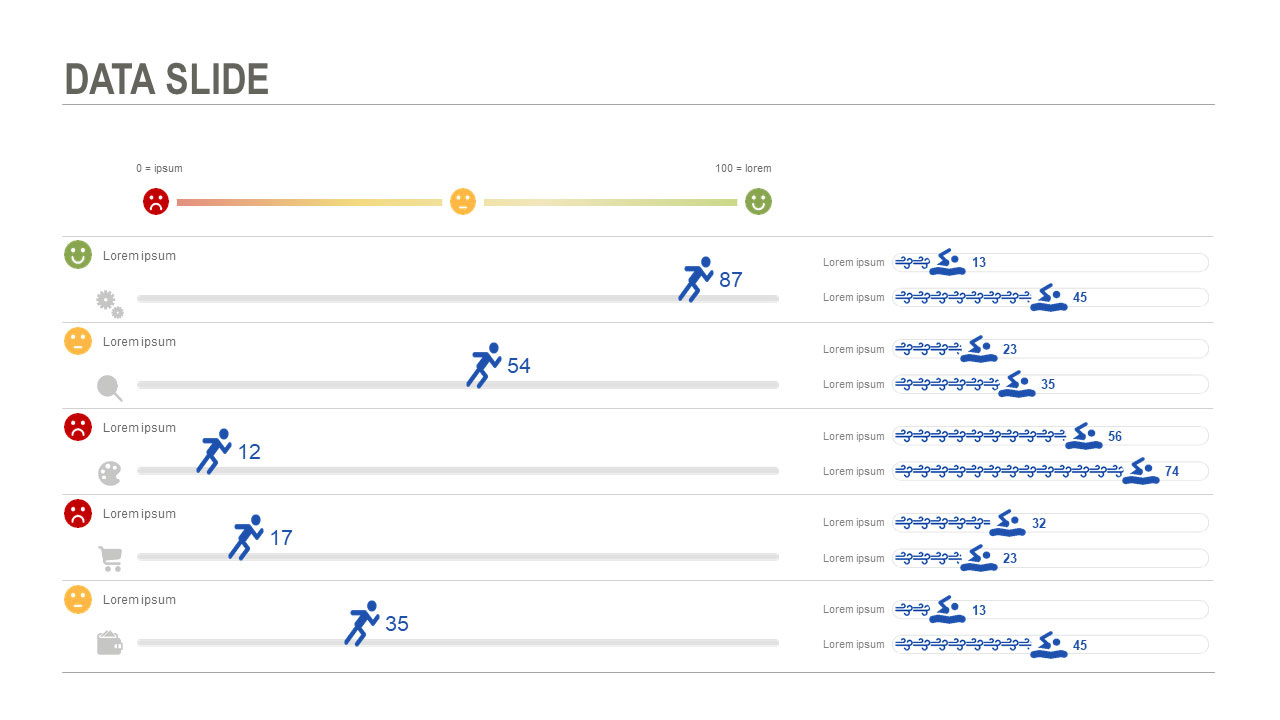
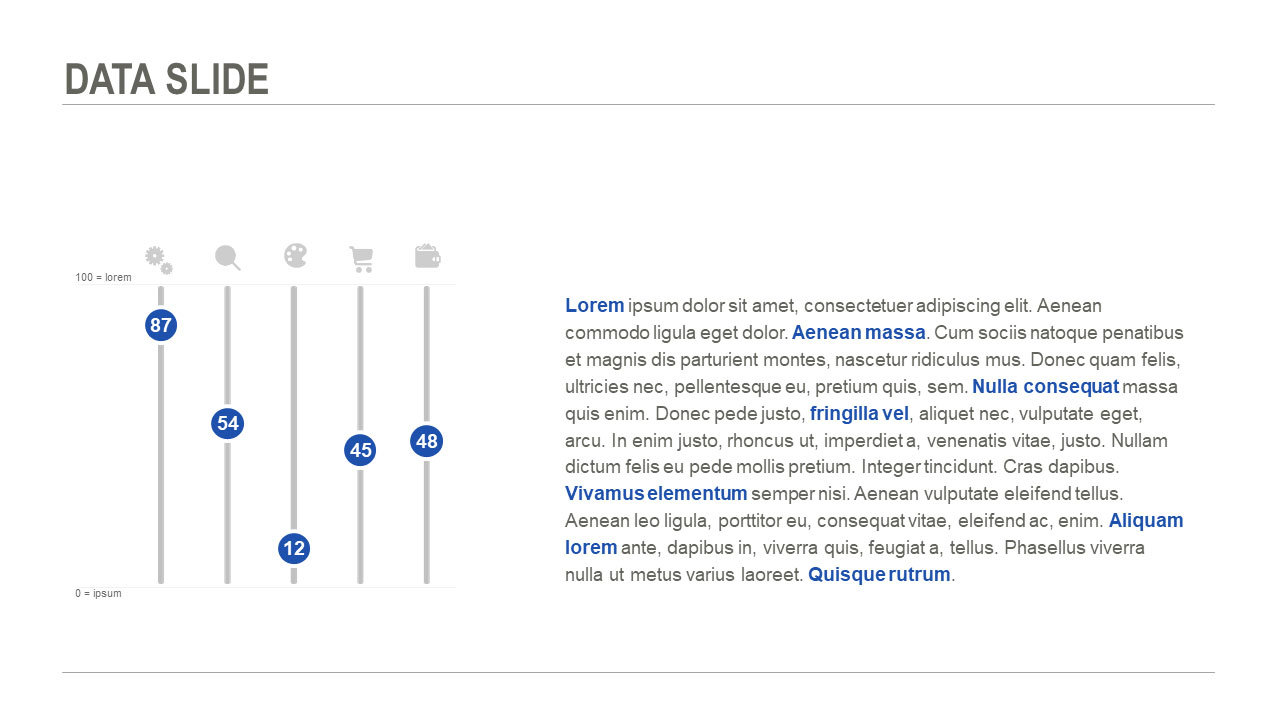
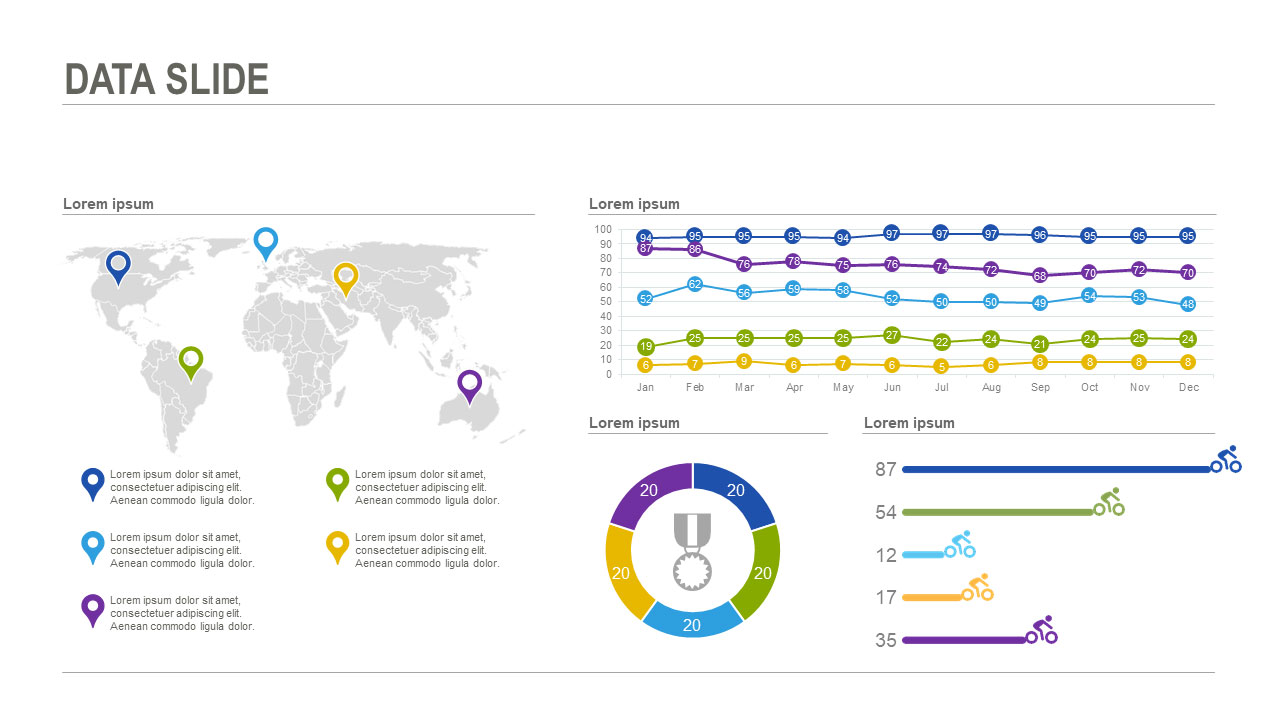
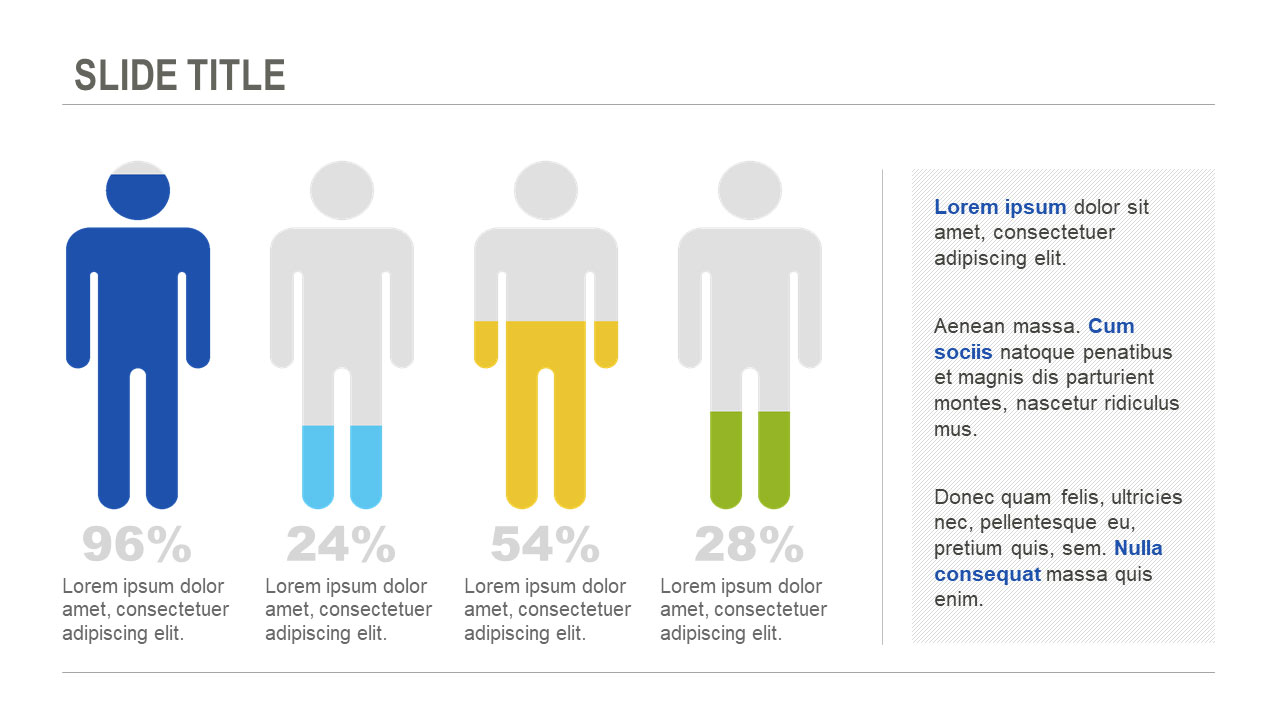
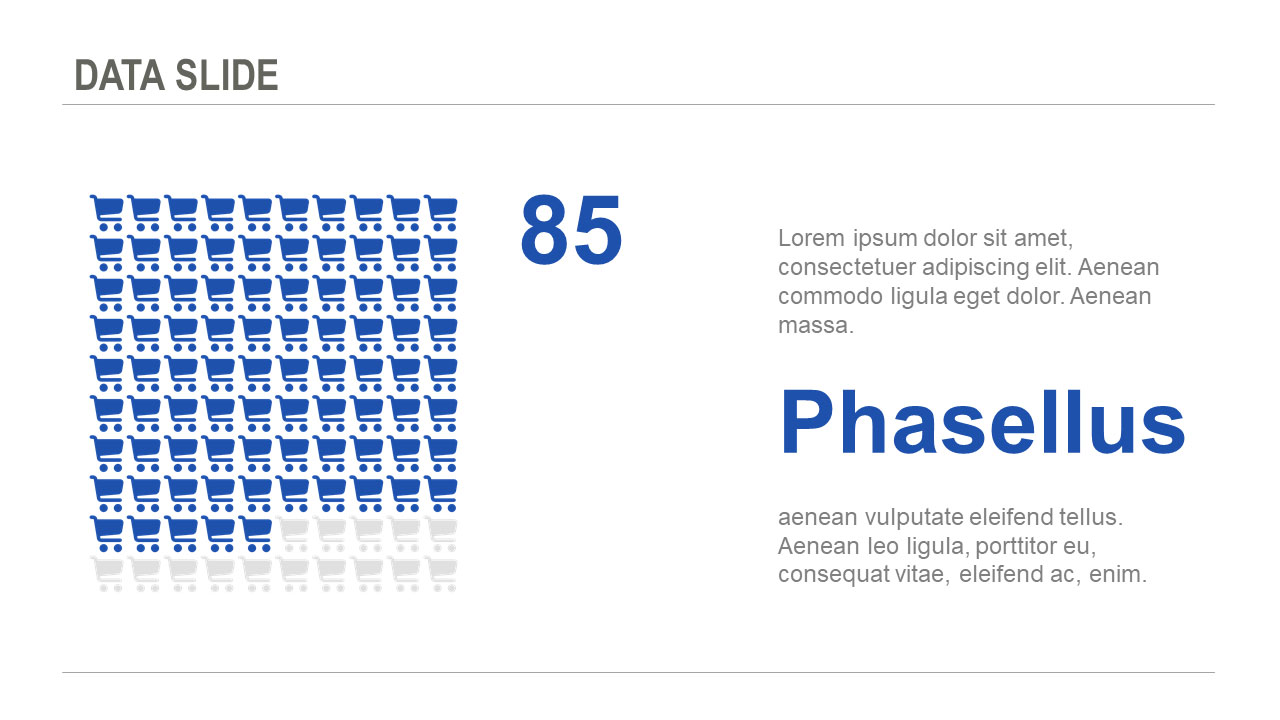
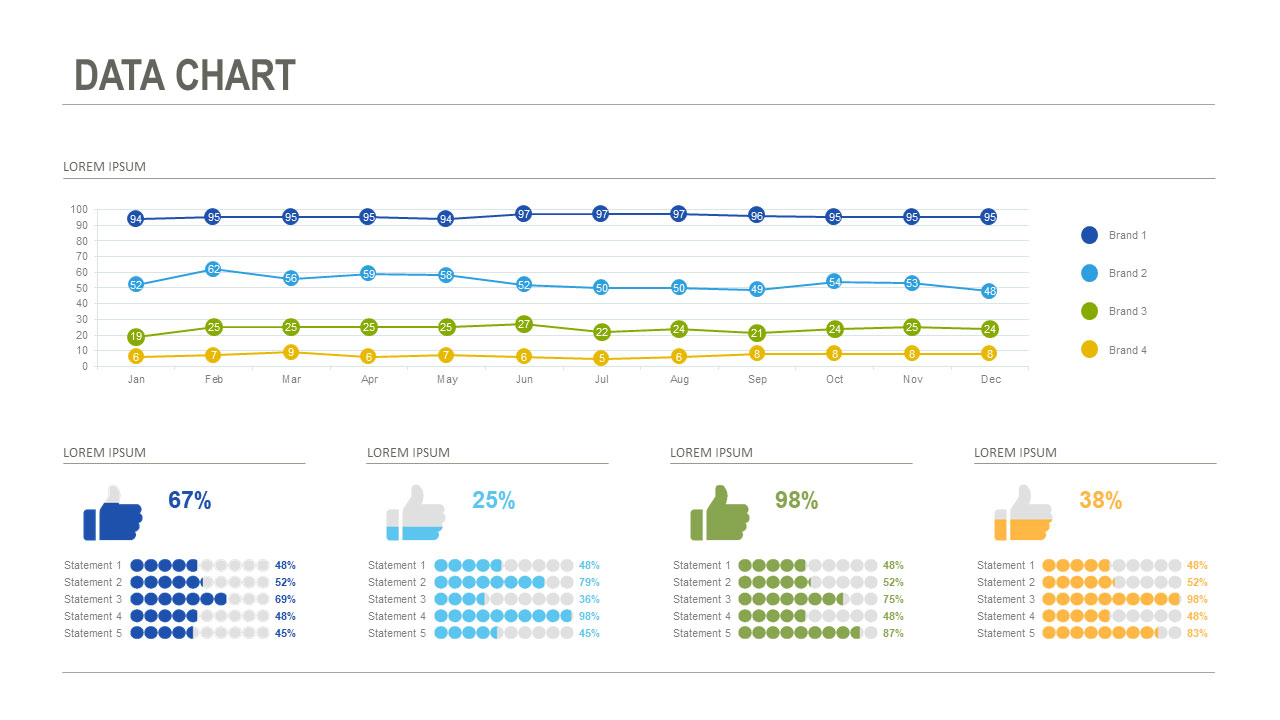
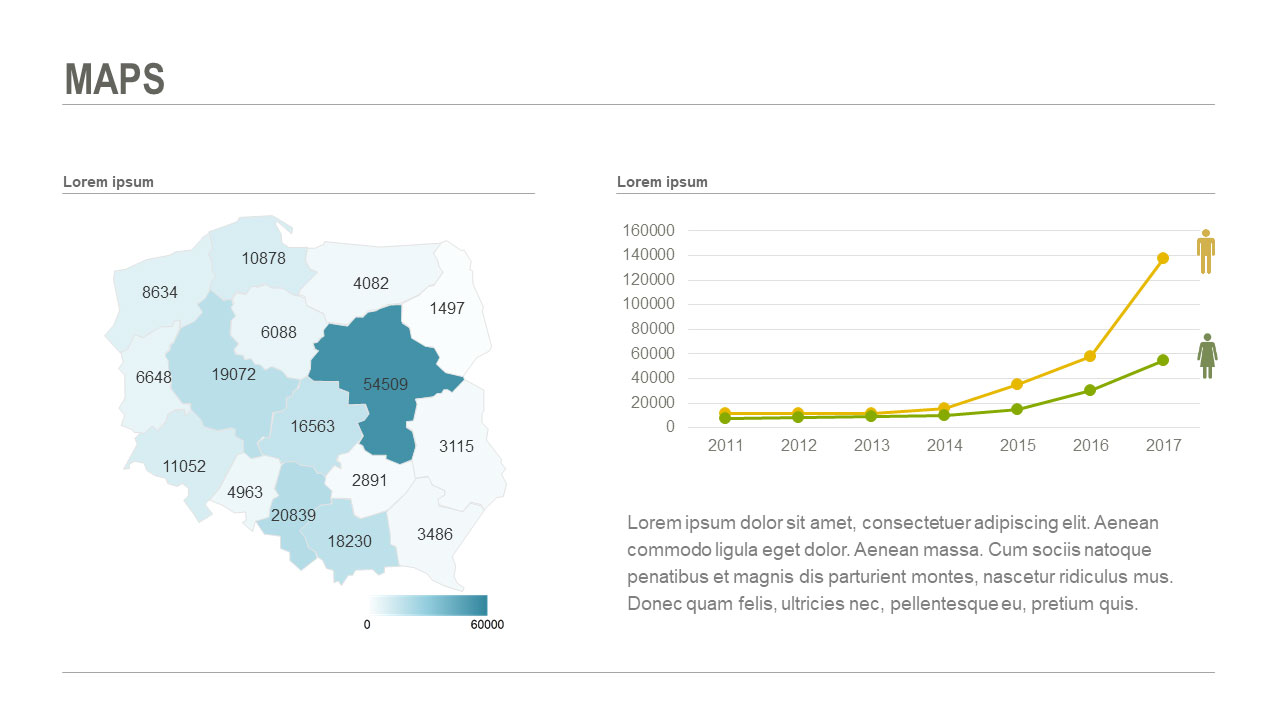
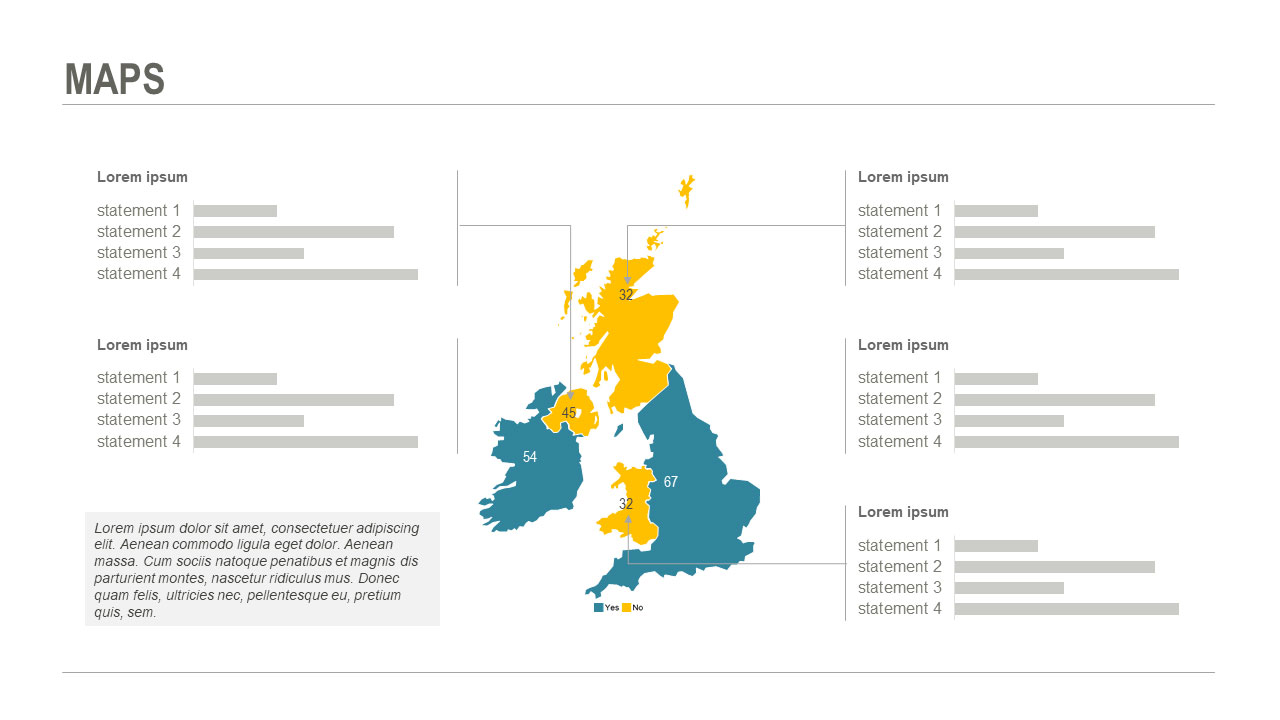
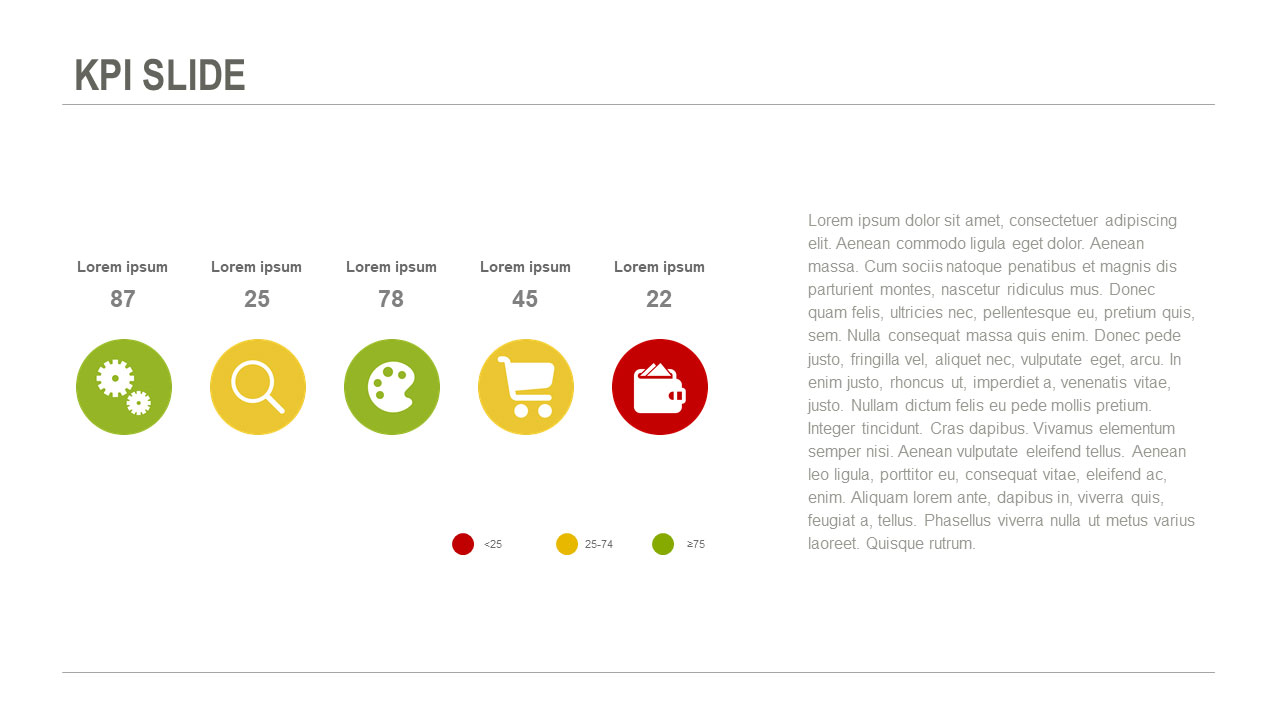
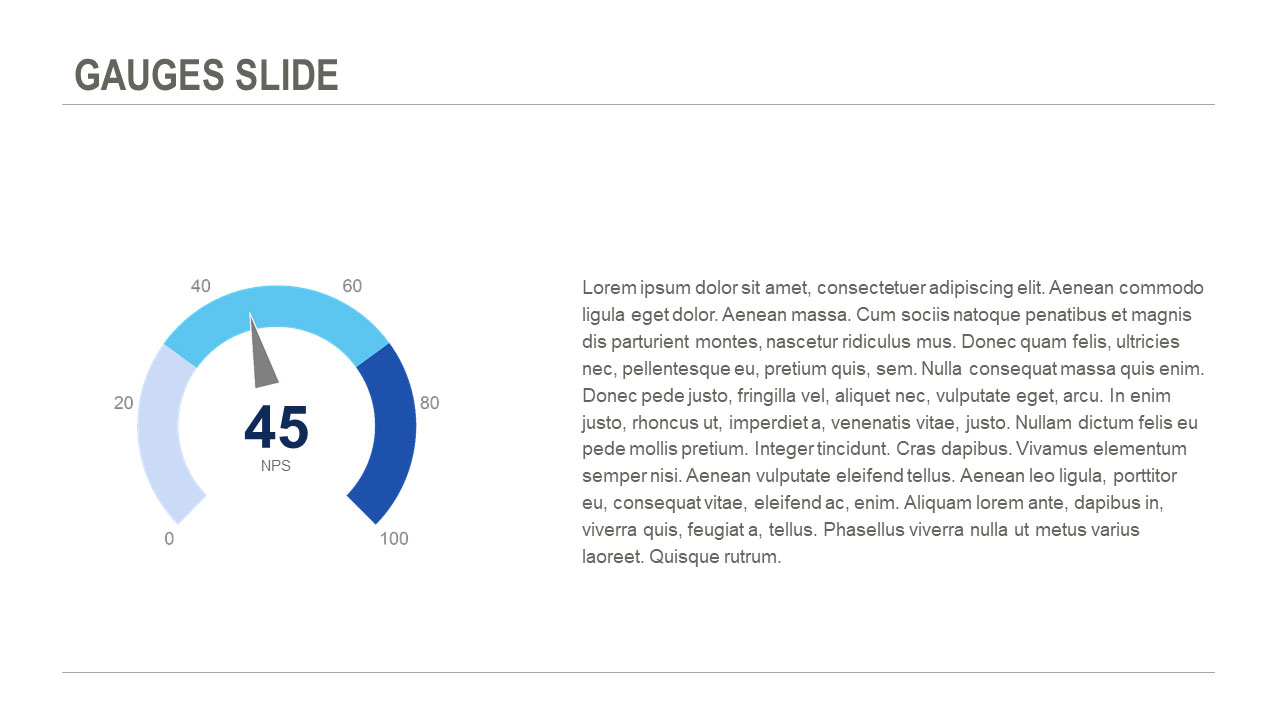
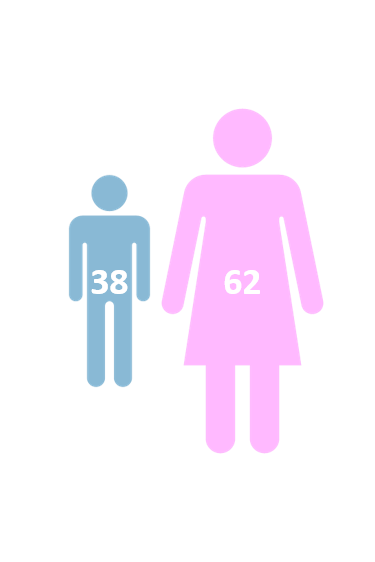
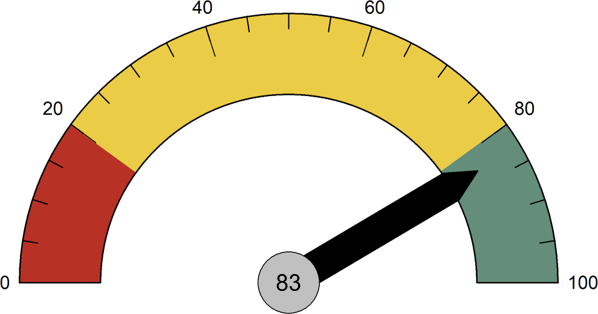
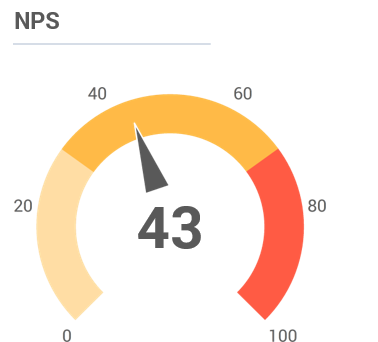
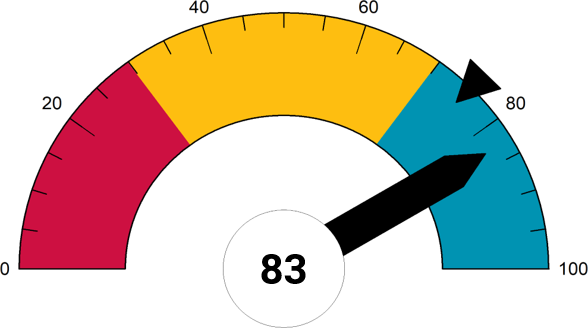
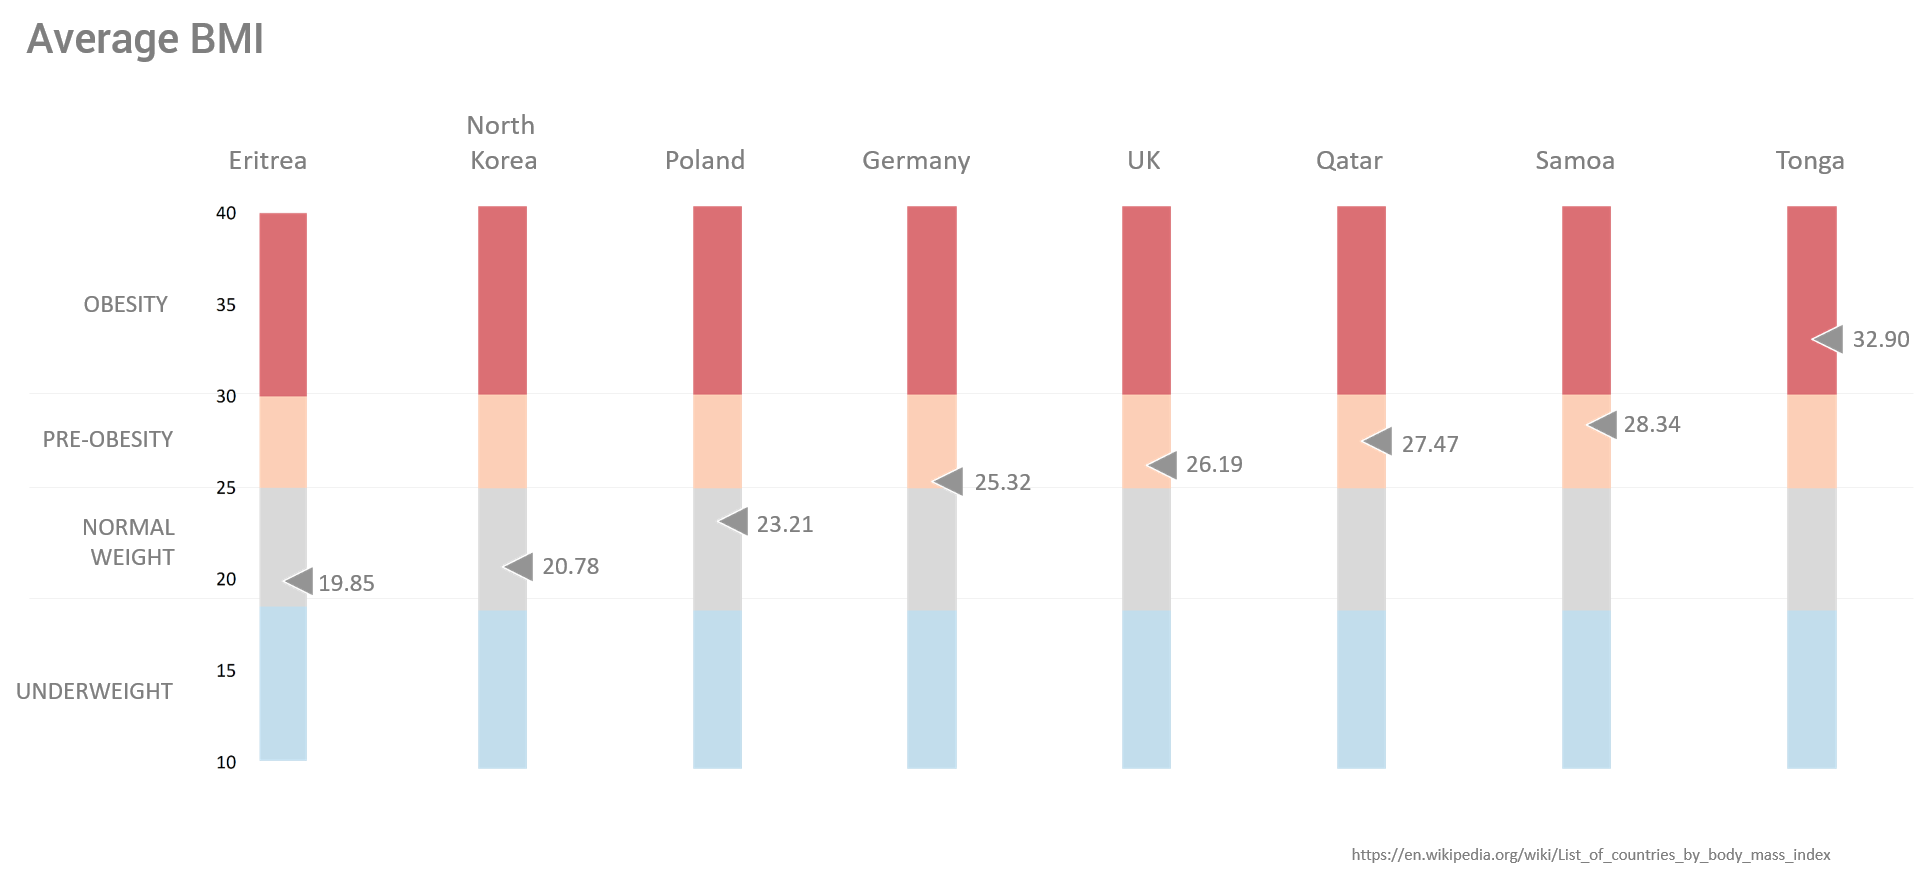
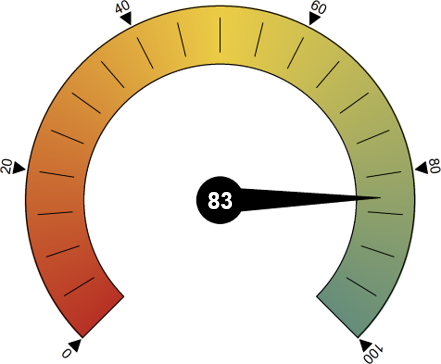
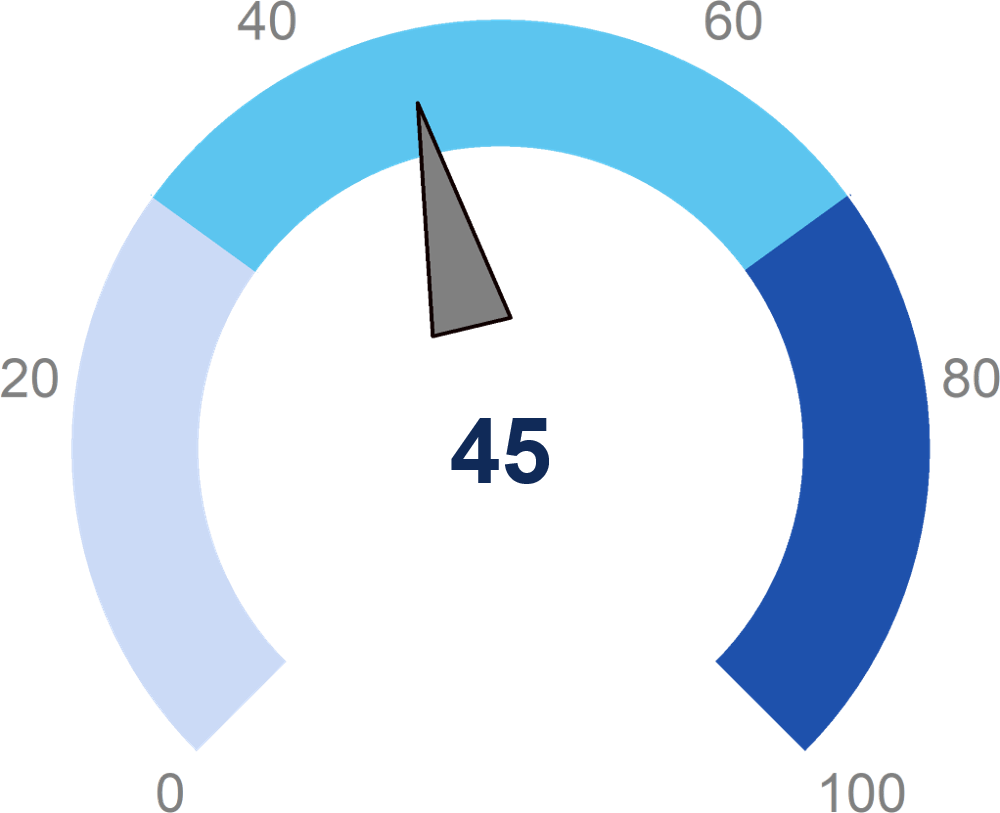
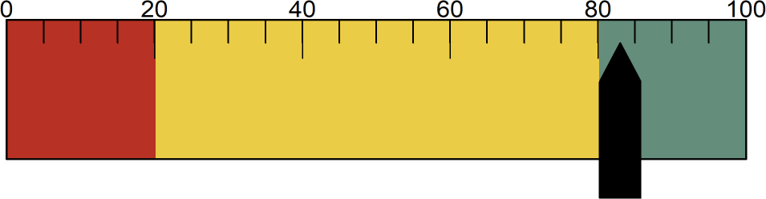
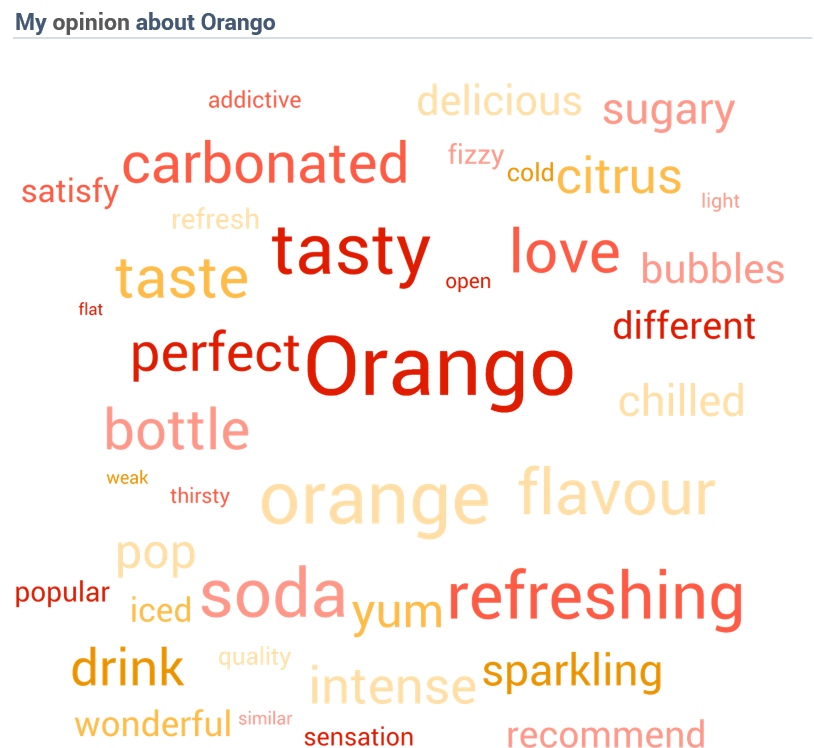
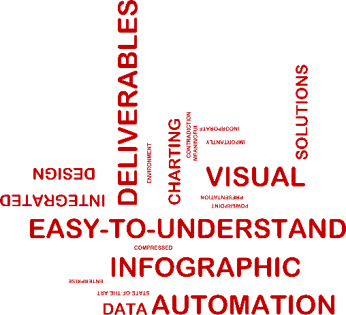
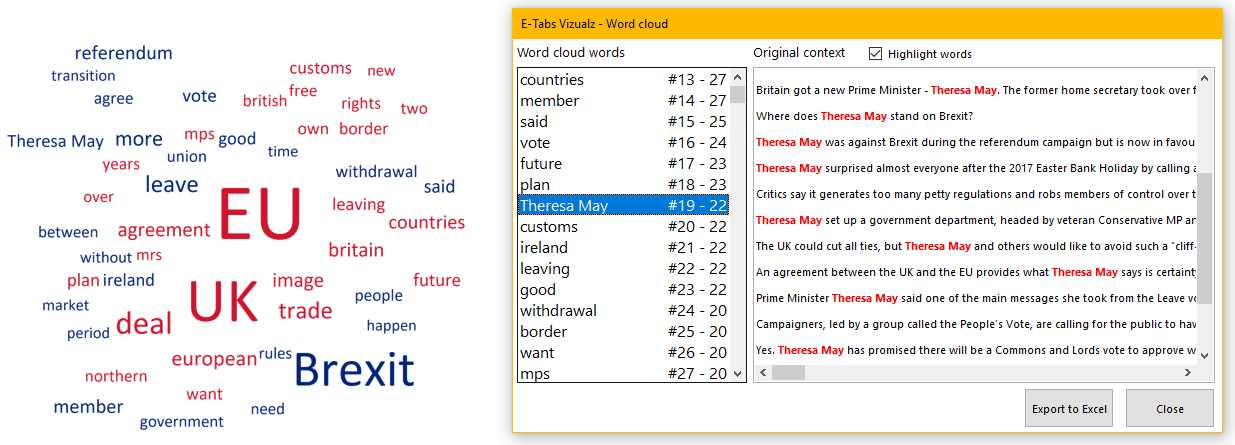
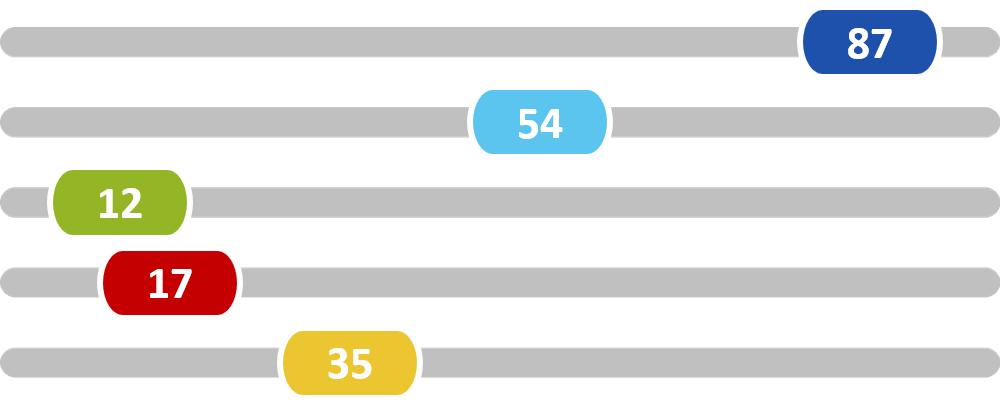
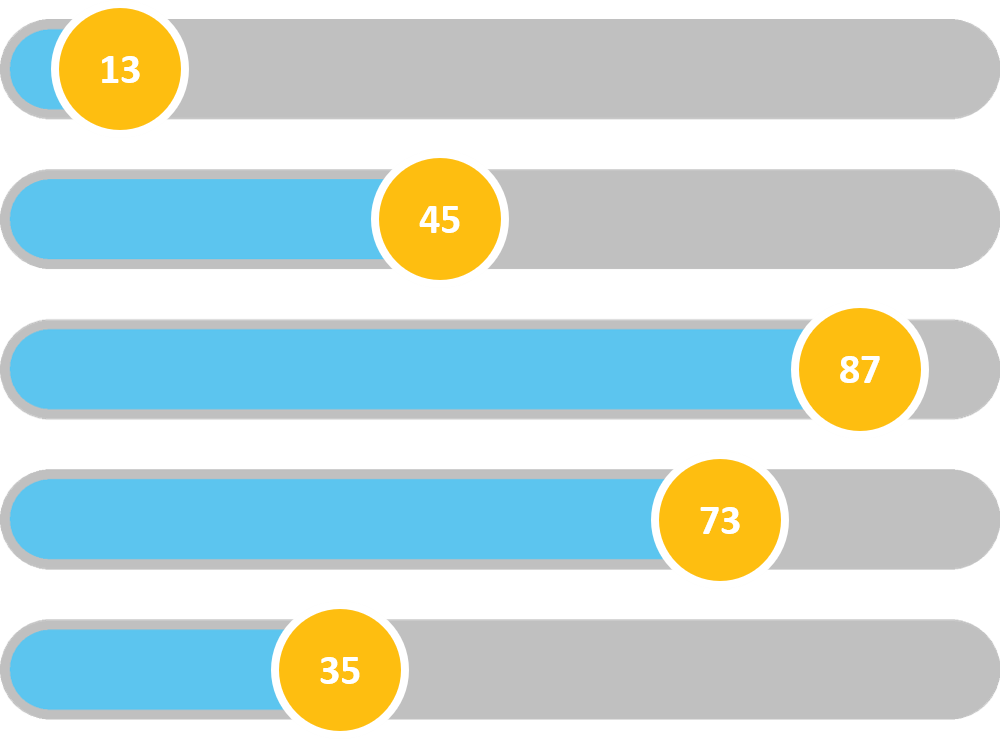
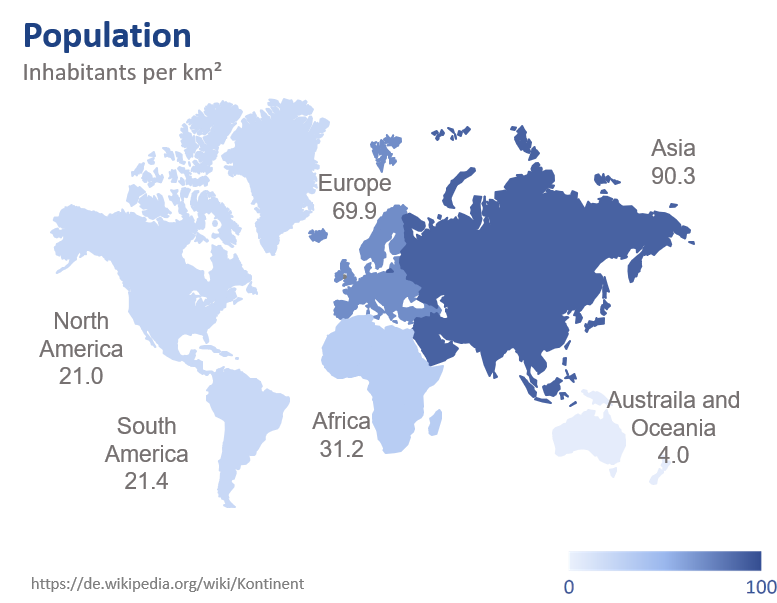
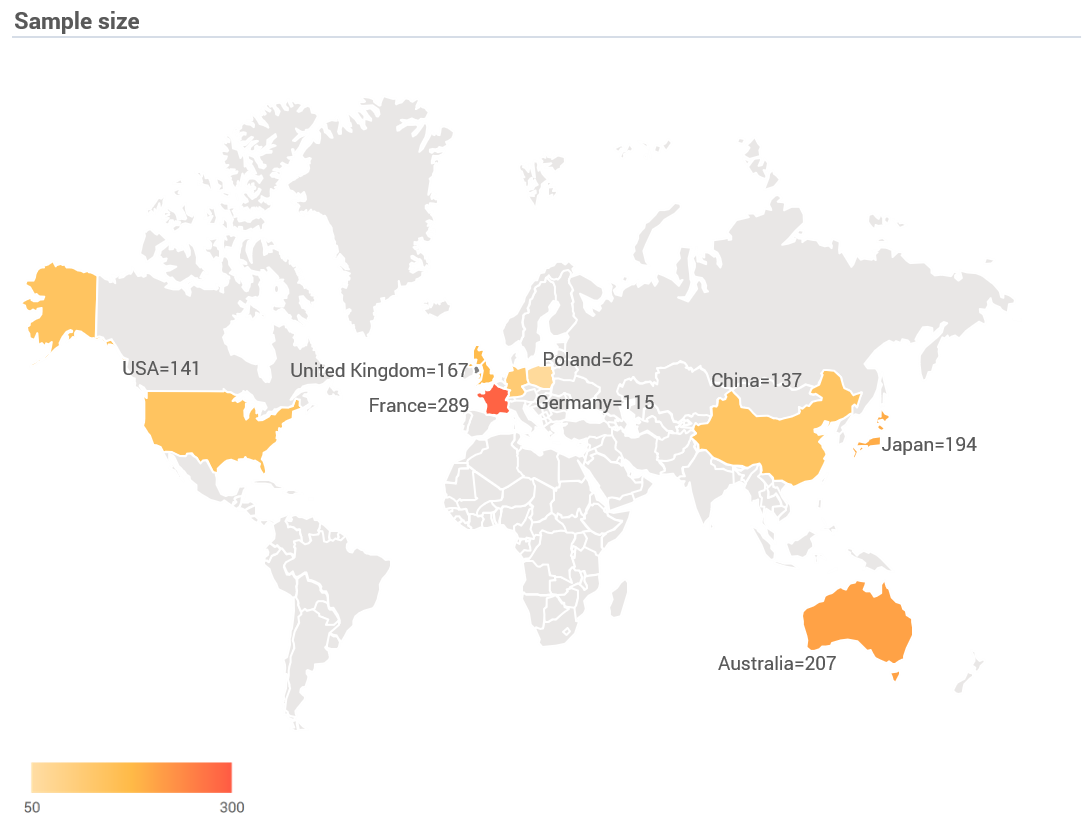
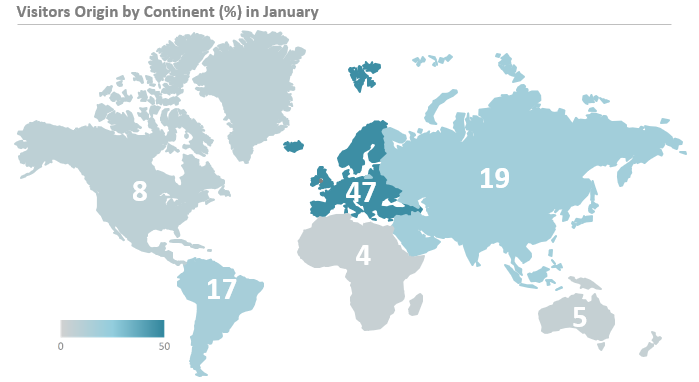
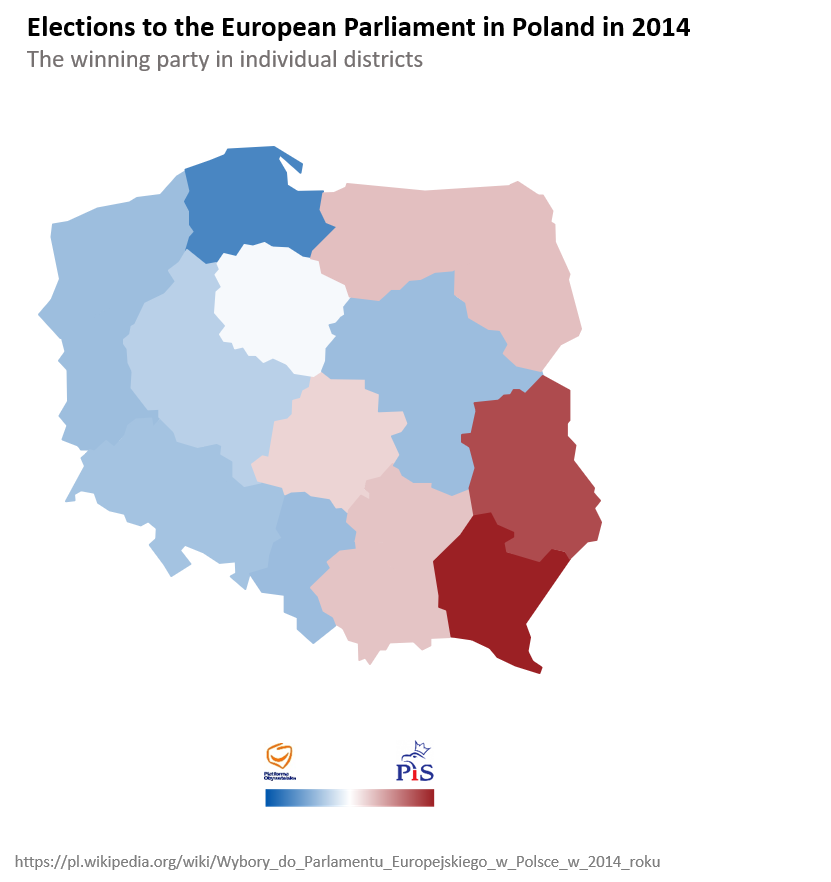
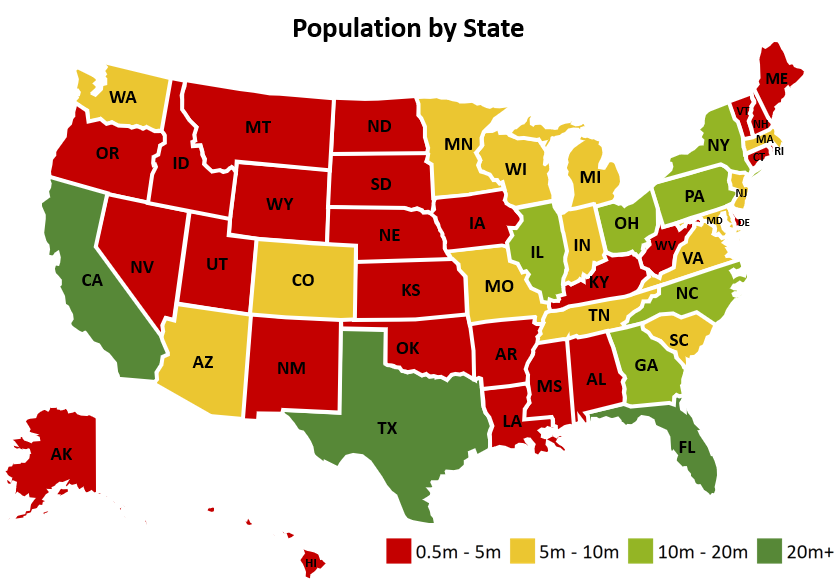
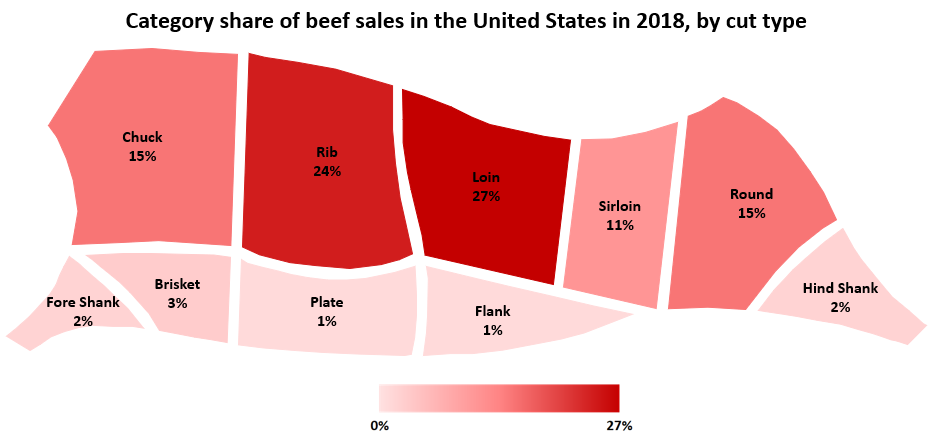
With Vizualz you can create a whole range of infographic types including filled, repeated & proportional images, gauges,
maps, word clouds and more. Utilise hundreds of built-in icons or import your own brand logos, icons and pictures.
Incorporate these infographics into your own client presentations or even choose from a selection of expert data-designed slide templates that are included with Vizualz.
Vizualz - get creative with your data today!


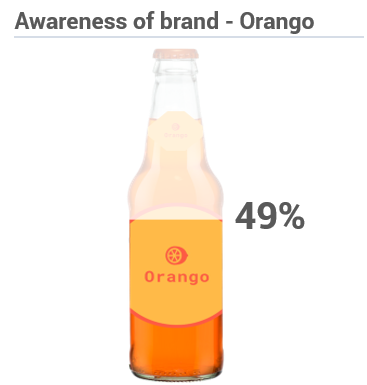
Richard Clarkson,
Head of Strategic Consumer Insights and Segmentation. Orange, UK
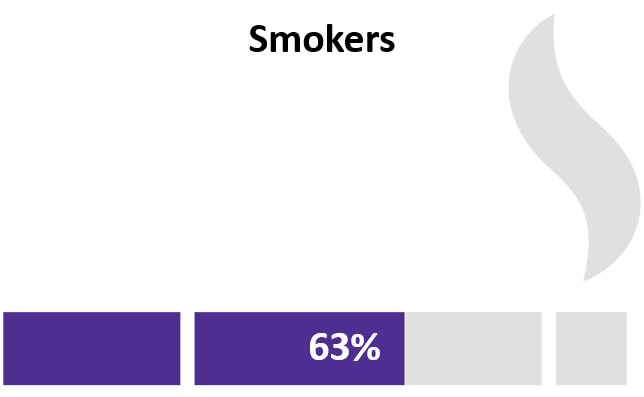
Charlotte Heron,
Associate Director at Synergy Healthcare Research