

Automation can handle variations, by Jon Hackenbroch
When working with multiple output projects, one of the key points to clarify before starting any automation is to check for any variation between reports or slides. While you may feel a questionnaire is identical between markets, there can be a number of things that will create a difference in the reporting outputs. These can come from country-specific brand lists, statements or open ended questions. Often when I ask if there are any differences between reports, I am told they are all the same, and it is only with some further questioning that we discover the full scope of variation.
We use E-Tabs Enterprise to automate and this can handle a great deal of variation, but it is very important to plan for this right from the start of the project setup.
When looking at variation, I will do a full review of the template to ensure that all design elements can handle differences. I will rarely change a design but would advise alternative options in the template to handle differences while maintaining any look and feel already there.
A common scenario can be in brand awareness or satisfaction projects, where there are changing brands between markets. This differences in brands can vary in complexity; here are some examples of common situations we have had to handle:
- Changing brands between markets – looking at a mix of global and local brands
- A differing number of brands – different markets may have more or fewer brands
- More than one client brand in some markets
- Changing competitor brands in each market
All we need is a clear logic and well-defined rules, to ensure the template is built to work with the highest potential number of brands.
For example, the UK has a single client brand and 3 competitor brands, while other markets have a single client brand and 4 competitor brands. In this case, I would build the automation to work for 5 brands (or more, if this may change in the future). The automation will automatically remove excess bars and references to the extra brands when it runs.
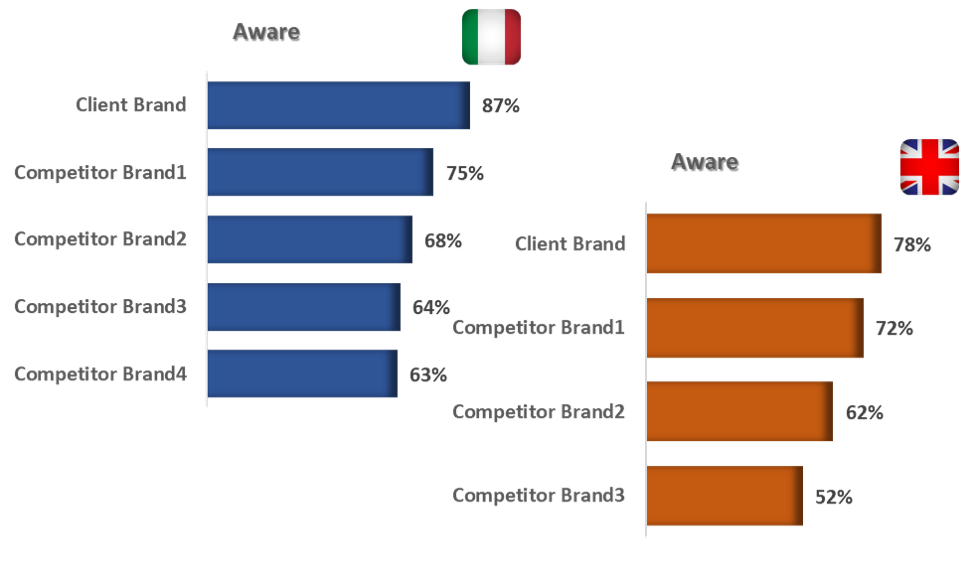
As mentioned above, you need to keep in mind if your template can handle the variation. If you have a PowerPoint bar chart, this will automatically resize in PowerPoint and the formatting will all remain consistent.
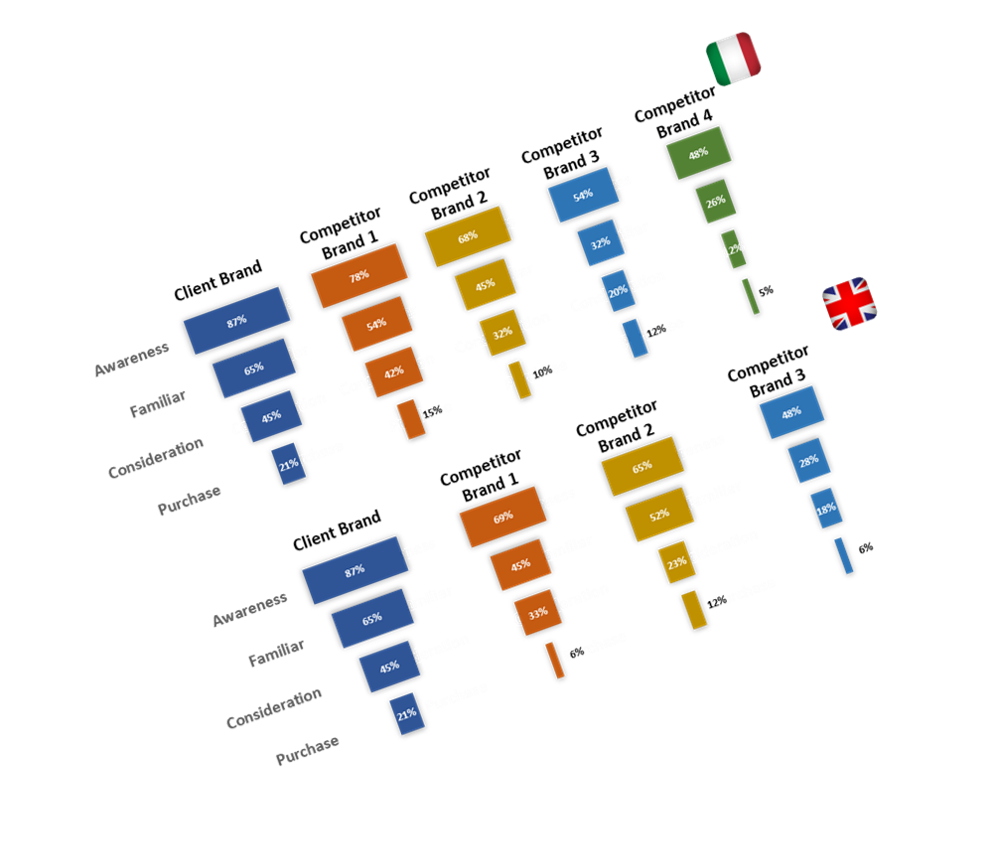
However, if you have a slide designed with, for example, 4 funnel charts on, that will sometimes need to show 5 funnel charts, this will not automatically format nicely for both report variations. We would need to make a plan to handle this in the most optimum way. One option is to have a single design of the slide template to handle both 4 or 5 funnels, and we then can delete and move objects in the automation if necessary. Alternatively, when the design is specific for one market, we may duplicate the slide and modify the design for the 5 funnels, so that we actually have a slide for each market in the template, and then automatically remove the slide or slides that we don’t need when running each market.
Yes, everything is almost the same…
Brand variation is just one example of differences in reporting requirements. Variation can be present in questions or charting requirements, conditional formatting etc that can change between reports. If you have any questions on project variation in automation, please be in touch and I’d be happy to review your projects.

If you have any questions, tips or would like to discuss your next project for automation with Jon Hackenbroch, please fill in the form below and he will be in touch!
