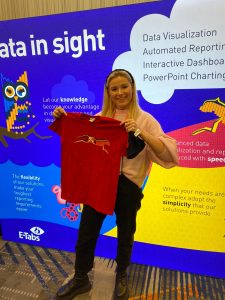
We’re excited to announce our 2023 conference tour began with Quirks LA on February 22nd-23rd! The two day event took place in Los Angeles, California.
As always, our friendly staff wereon hand to talk Report Automation, Data Visualization, Dashboards and PowerPoint Charting. We will be showcasing the recently launched Enterprise Cloud, capable of producing editable PowerPoint/Google Slides exports from online dashboards such as PowerBI, Tableau and more.
We were privileged excited to present at Quirks LA alongside Christine Sathre, from Material! Session details below!
Euphoria! How Material leverages report automation for faster, more efficient, and more accurate project reporting
Description: Material’s Global Tracking team runs many complex trackers – the vast majority of which are multi-market. They have been able to automate even the finest of detailed formatting requirements within the reporting, resulting in drastically reduced production times and optimized efficiencies. Learn how this has been achieved and just how far you can go with innovations in automated reporting.
Key Takeaways Include:
– What to look for and plan when automating your reporting of large projects
– Key differences when automating PowerPoint versus Google Slides
– Automation isn’t just relevant to trackers and continuous studies but many study types
For more information on Quirks LA, visit the website here.
We look forward to meeting you all at the event!
Presentation With Kantar!
It’s magical! How Kantar leverages report automation for faster, more efficient and more accurate project reporting.
Report automation is often thought of as limited to just mass generation of charts, but it can be so much more than that. Kantar runs many large ongoing projects where the level of detail needed in the reporting can be very complex. There are multi-market projects where the brand lists and questionnaires vary between markets and waves needing multiple levels of statistical testing and conditional placement of indicators and brand logos. For optimal efficiency, gains more than just a deckful of charts was needed.
This joint presentation between Kantar and E-Tabs explores how an innovative automation solution can be implemented that saves many days and weeks of manual data-posting and charting on every project, with the added bonus of happier staff, happier clients and increased profit margins.
The presentation will cover the process of automated reporting for traditional projects in both PowerPoint and Google Slides as well as how this technology has evolved into a Cloud-solution offering on-demand exporting from online dashboards into editable, native chart decks.
Key takeaways:
- What to look for and plan when automating your reporting of large projects.
- Key differences when automating PowerPoint versus Google Slides.
- Automation isn’t just relevant to trackers and continuous studies but many study types.
Here are a few pics from our last outing @ Quirks 🙂
