 Introducing… Online Dashboards Export To Editable PowerPoint
A copy of our Press Release announcing Enterprise Cloud! Online Dashboards export to Editable PowerPoint January 13th, 2022. E-Tabs are delighted to announce the launch of Enterprise Cloud – a cloud-based report automation platform for generating fully editable reports in PowerPoint and Google Slides/Sheets. Researchers have struggled to obtain EDITABLE PowerPoint charts and Google Slides […]
 Quirks New York
Quirks New York will be taking place next week (November 2-3) and we will be exhibiting our innovative software and solutions at stand 415! Pop by and chat with members of the team to learn more about E-Tabs Enterprise’s recent integration with Google Slides and Sheets. As always we will also be on hand to […]
 Enterprise Cloud – Editable PowerPoint Export
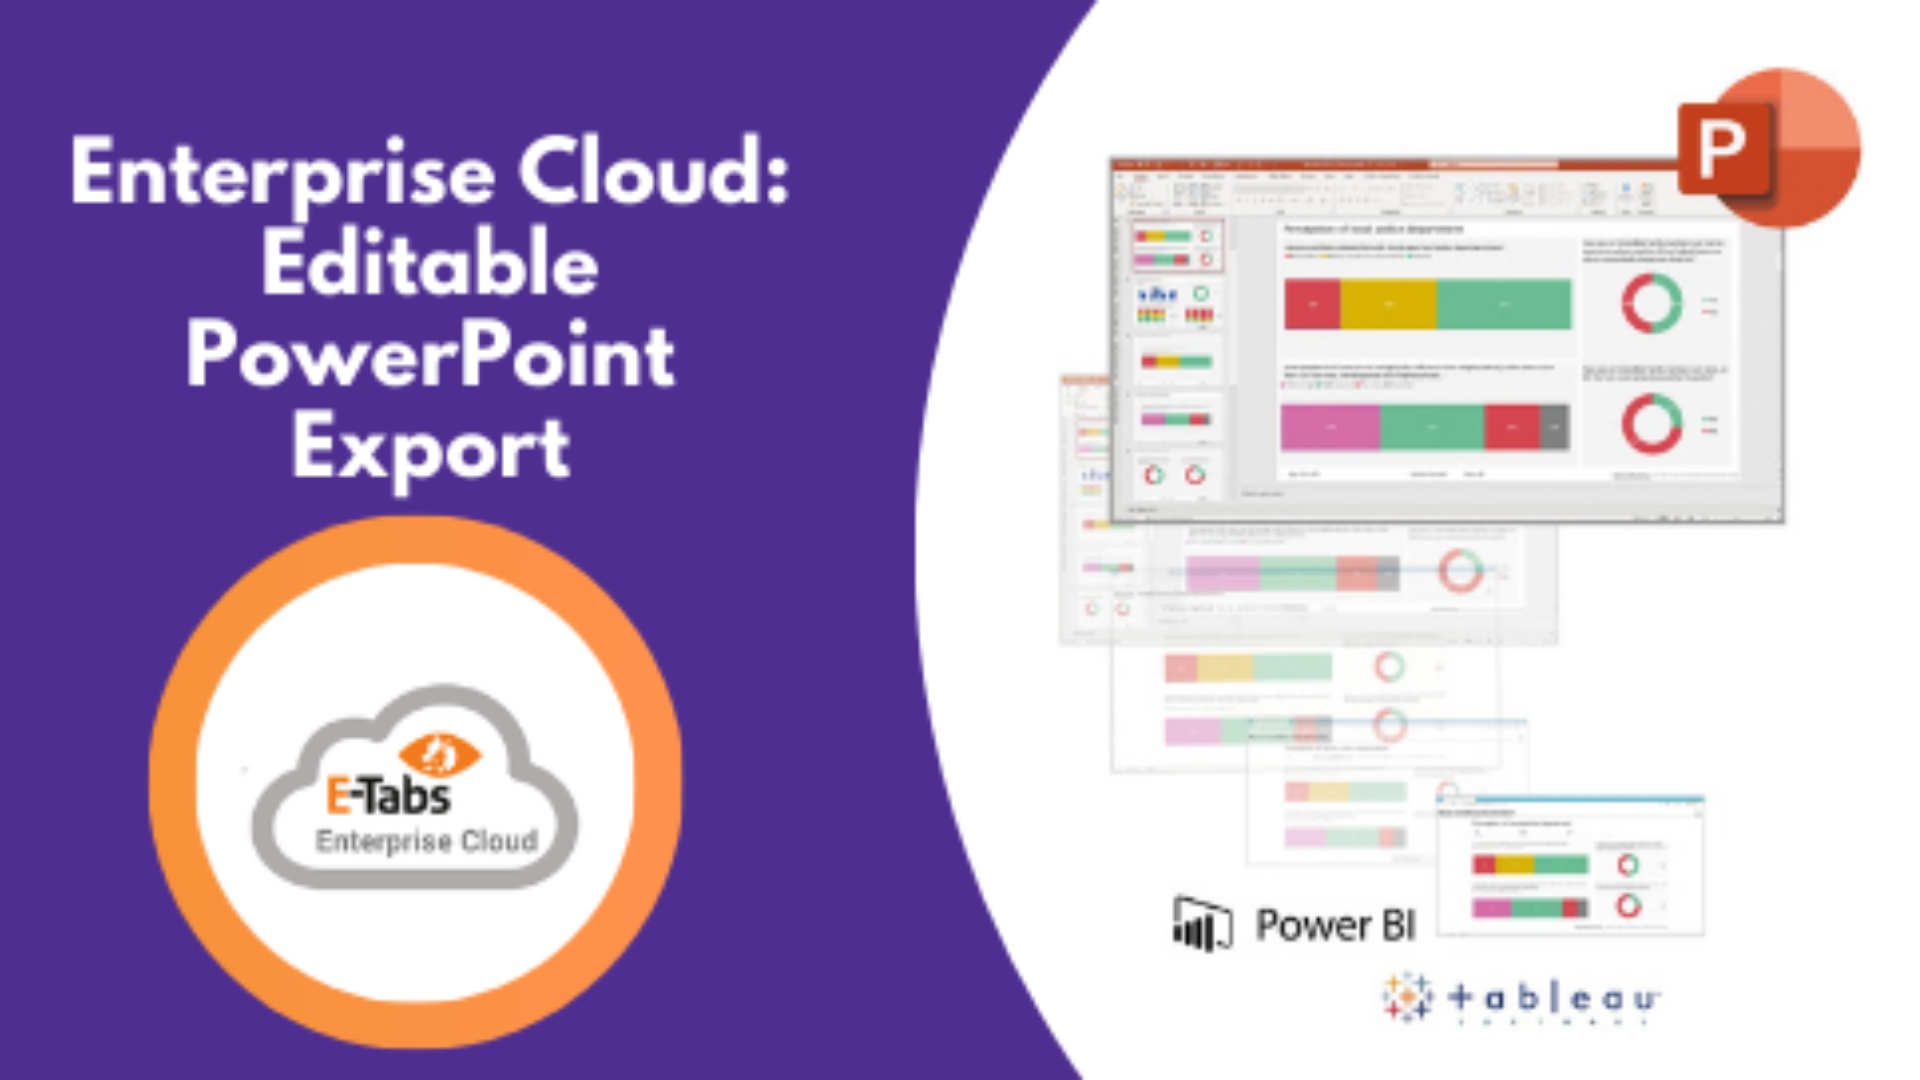
Are you looking to generate EDITABLE PowerPoint charts / Excel reports from your online dashboard or CRM systems? Enterprise Cloud is a cloud-based report and chart automation platform that can accept data from anywhere, and then populate a native PowerPoint or Google Slides ‘template’ deck including fully editable charts and tables. Online dashboard products, including […]
 Case Study: The Olinger Group
Who are The Olinger Group? For the past 27 years, The Olinger Group has been a national leader in marketing research for the world’s top companies and brands. With profound expertise in both quantitative and qualitative research studies, The Olinger Group specializes in custom, primary research designed specifically for each client’s unique set of needs. […]
 A first for the integration of automating market research data & Google Slides
An Industry First – Fully Automated Charting & Reporting in Google Slides! Hailed as a first for the integration of automating market research data and Google Slides, reporting solutions provider, E-Tabs have announced the launch of Google-charting integration within their report automation platform, E-Tabs Enterprise. Until this point, many research providers were limited to providing […]
 Webinar – Cutting Edge Automated Charting
Cutting Edge Automated Charting Missed our automated charting webinar? You can view the recording below! Key Takeaways included: – The difference between an automatically generated chart and a fully loaded deliverable.– How automated reporting can be used on many project types, including ad-hoc and multiple outputs including Google.– Leveraging automated charting to include fully editable […]
 Enterprise & Google Slides
Enterprise & Google Slides Over the past few months, the E-Tabs development team has been working on integrating our report automation software, Enterprise, with the Google Suite. This new development will enhance E-Tabs Enterprise’s leading platform for the automation of Market Research reporting in Microsoft Office. This decision to integrate Enterprise with the Google Suite […]
 Bring Your Reporting To Life With Instant PowerPoint Infographics
Bring Your Reporting To Life With Instant PowerPoint Infographics Ensuring that your research data is more visually engaging and easily grasped is more important than ever. Data Visualizations such as proportional infographics, gauges, maps, wordclouds and more, allow you to express the data in a way that’s often easier to comprehend than just typical PowerPoint […]
 Webinar – Dashboard Success With Edison Research!
Dashboard Success With Edison Research There is an increasing demand for visually appealing, interactive access to survey results in market research. Online dashboards can provide a great reporting solution, but what truly makes for a successful dashboard? In this webinar hosted by E-Tabs, Benjamin Rietti and guest presenter Nicole Beniamini from Edison Research, outline the […]
 Taking Automated Charting and Reporting To The Next Level
Taking Automated Charting and Reporting To The Next Level Join our upcoming Automation webinar presented by Benjamin Rietti! Find out how you can be more efficient with your charting and reporting. Taking place on Wednesday May 12th at the following times: London 4:30 BST New York 11:30 EDT Session Description Budgets tightened and profit margins […]
