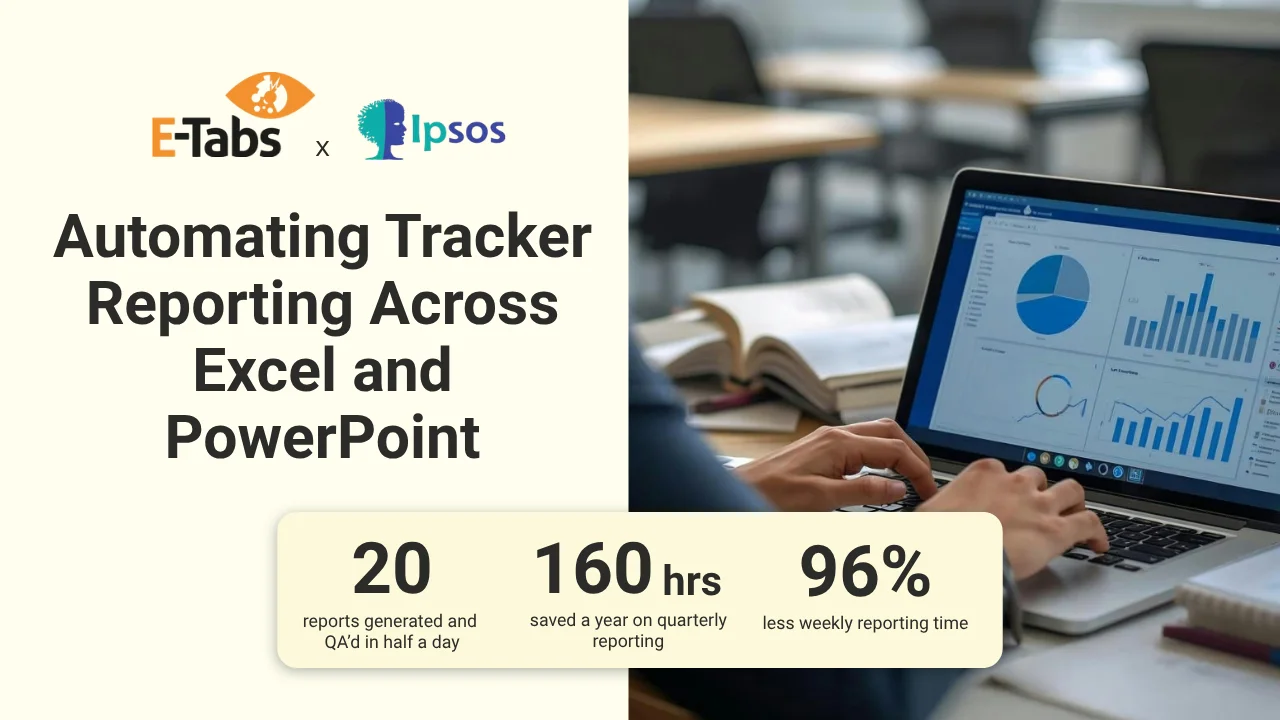

Producing recurring tracker reports by hand was costing Ipsos up to 100 hours a week. By automating report population, stat testing and QA with E-Tabs, the team cut production time by up to 96% across weekly Excel and quarterly PowerPoint deliverables.
About Ipsos
Ipsos is a multinational market research and public opinion firm, and one of the world’s largest insights organisations. It helps clients understand consumers, brands and markets through work spanning brand and advertising research, customer experience, media measurement, public opinion polling and large-scale tracking programmes.
The Challenge
For Ipsos, the challenge was the production effort of turning tracker data into client-ready reports, wave after wave. The structure stayed the same, but the work didn’t get lighter.
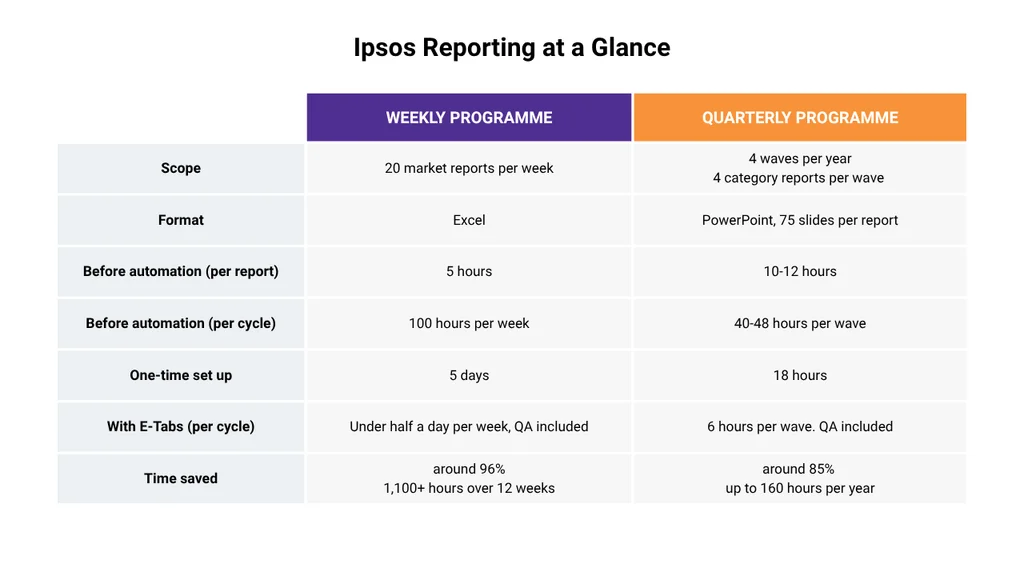
The first was an annual study with weekly reporting: 20 market reports every week for 12 weeks, delivered in Excel. Each report had to be populated with the latest data, stat tested, and checked against the study’s suppression rules before it could go out. At around 5 hours per report, that came to 100 hours of production every single week.
The second was a complex programme with quarterly deliverables: four waves a year, four category reports per wave, each running to around 75 PowerPoint slides. Every wave, the team had to populate current-wave results, stat test them, and sort them. Then they had to pull in year-to-date and previous-year figures and re-sort them to match the current wave. Each company’s results also had to be colour-coded consistently across every chart. Manually, this took 10 to 12 hours per report, or 40 to 48 hours per wave.
At those volumes, the time cost was only part of the problem. Every manual step was another chance for an error to reach a client.
The Solution
Ipsos used E-Tabs Enterprise to automate both programmes. The setup was built once and reused across every report, market, category and wave.
For the weekly study, the team built a single automated report in five days. That framework then generated all 20 market reports each week. Stat testing ran automatically, and suppression rules were specified upfront and applied every time without manual checking. All 20 reports were generated and QA’d within half a day.
For the quarterly programme, setup took around 18 hours. E-Tabs populated the current wave, ran stat testing at multiple levels, and sorted the results. Year-to-date and previous-year data were then populated and sorted automatically to follow the current wave’s order. Chart bars were colour-filled by company, so each brand kept the same colour across all 75 slides. The same setup was reused across all four categories, bringing a full wave, QA included, down to around six hours.
The Results
Weekly reporting cut by ~96%: Half a day replaced 100 hours of manual production each week. Across the 12-week programme, that’s more than 1,100 hours saved, and the five-day setup paid for itself in the first week.
Quarterly reporting cut by ~85%: Each wave dropped from 40–48 hours to around 6, saving up to 160 hours a year. The 18-hour setup was recovered within the first wave.
Consistent QA: With stat testing, suppression and sorting automated, outputs stayed consistent across markets, categories and waves. QA could focus on checking the output rather than catching manual slips.
Built to scale: Once each framework was in place, additional reports and waves could be produced without a matching increase in effort.
The Bigger Impact
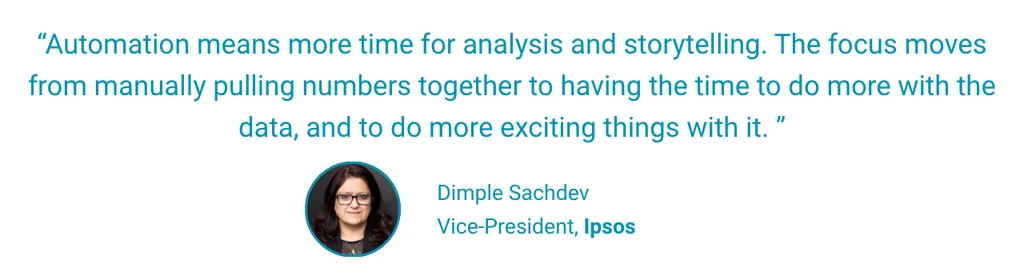
For Ipsos, the hours saved were only part of the value. By building statistical testing, suppression rules and formatting standards directly into the workflow, the team turned two heavy recurring programmes into a repeatable process. Speed and quality no longer pulled against each other. Researchers spent less time producing and checking reports, and more time doing more with the data: exploring results, developing insights and strengthening the stories they bring to clients.
Here for you
At E-Tabs, we are committed to delivering exceptional products and services that grow with your reporting needs. To ensure our partners get the most out of our solutions, we provide ongoing support and in-depth training, helping teams build scalable reporting workflows that are easy to manage, adapt and expand over time.