NEWS, EVENTS, & CASE STUDIES
Find our latest blog posts, webinars and upcoming events here!

Data Visualization, Best Practices: Simple Tips fo…
Data visualization is essential in today’s data-driven world, serving as a graphical representation of information. It simplifies complex datasets, revealing patterns, trends, and anomalies, and turns data i…
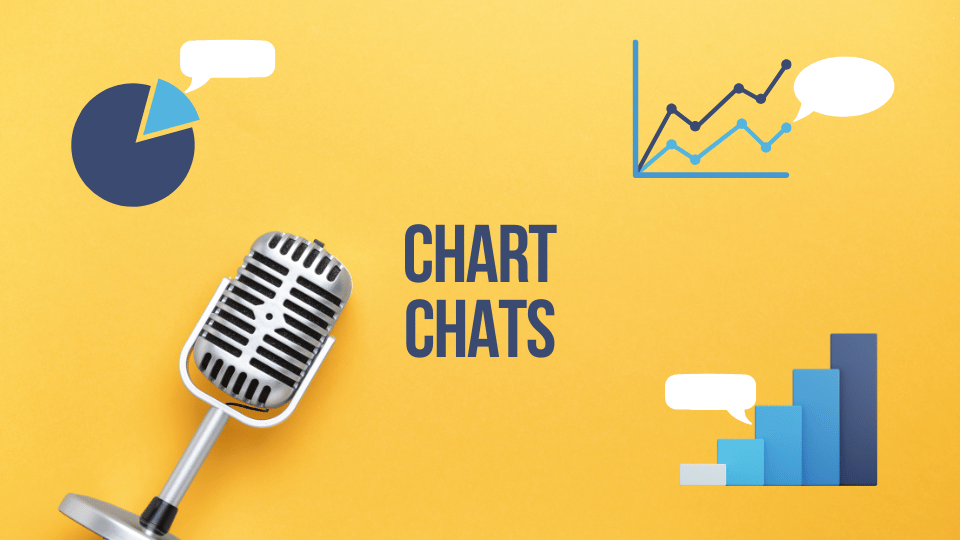
Chart Chats: Inside the World of Data’s Greatest…
Welcome to “Chart Chats”, the ultimate gathering of data’s finest emissaries! In this series, we’ll get to the heart of different chart styles to better understand how they tick, through intimate and humorous …

From Data to Storytelling: Crafting Compelling Nar…
The impact of Data Visualization in business and industry In today’s data-driven world, the ability to convey information effectively is crucial. But raw data alone often fails to resonate with audiences an…

Upcoming Webinar: Elevate Your Reporting!
Bring Your Reporting To Life With Instant PowerPoint Infographics! Date: 23rd May 2024 I Time: 4:00PM London, 11AM New York Presented by: Benjamin Rietti, CEO, E-Tabs …