NEWS, EVENTS, & CASE STUDIES
Find our latest blog posts, webinars and upcoming events here!
What is Google Slides Automation?
Google Slides is a cloud-based alternative to Micosoft PowerPoint for presentations. As part of the Google Workspace, it allows users to create, edit, and share presentations seamlessly online. Over the last c…
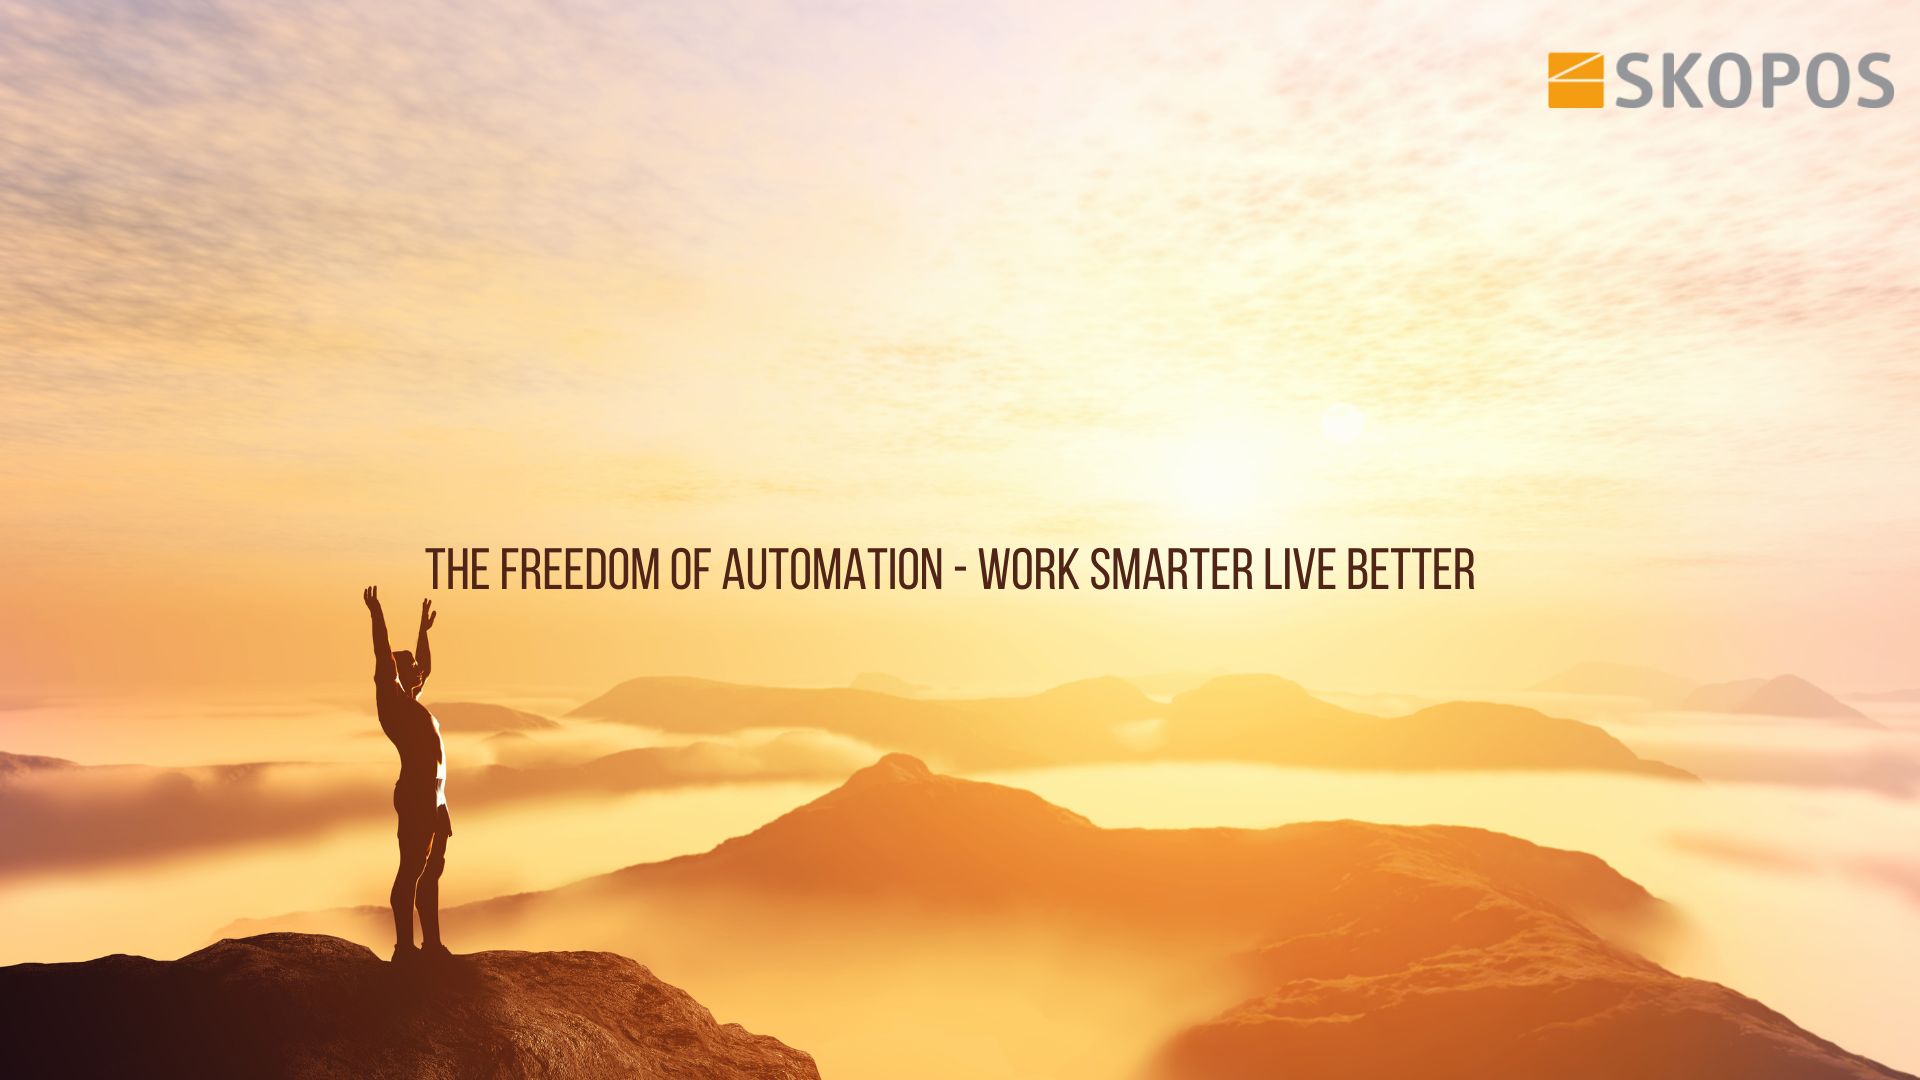
The Freedom of Automation: Work Smarter Live Bette…
We had the honour of meeting with SKOPOS to hear how they transformed their market research reporting. SKOPOS is a leading market research company based in Germany, dedicated to providing the founda…

Quirks London 2025
This week, the E-Tabs team had the pleasure of attending another vibrant Quirks Media conference—right here in our hometown! We connected with a wide array of market research professionals, exchanged ideas t…
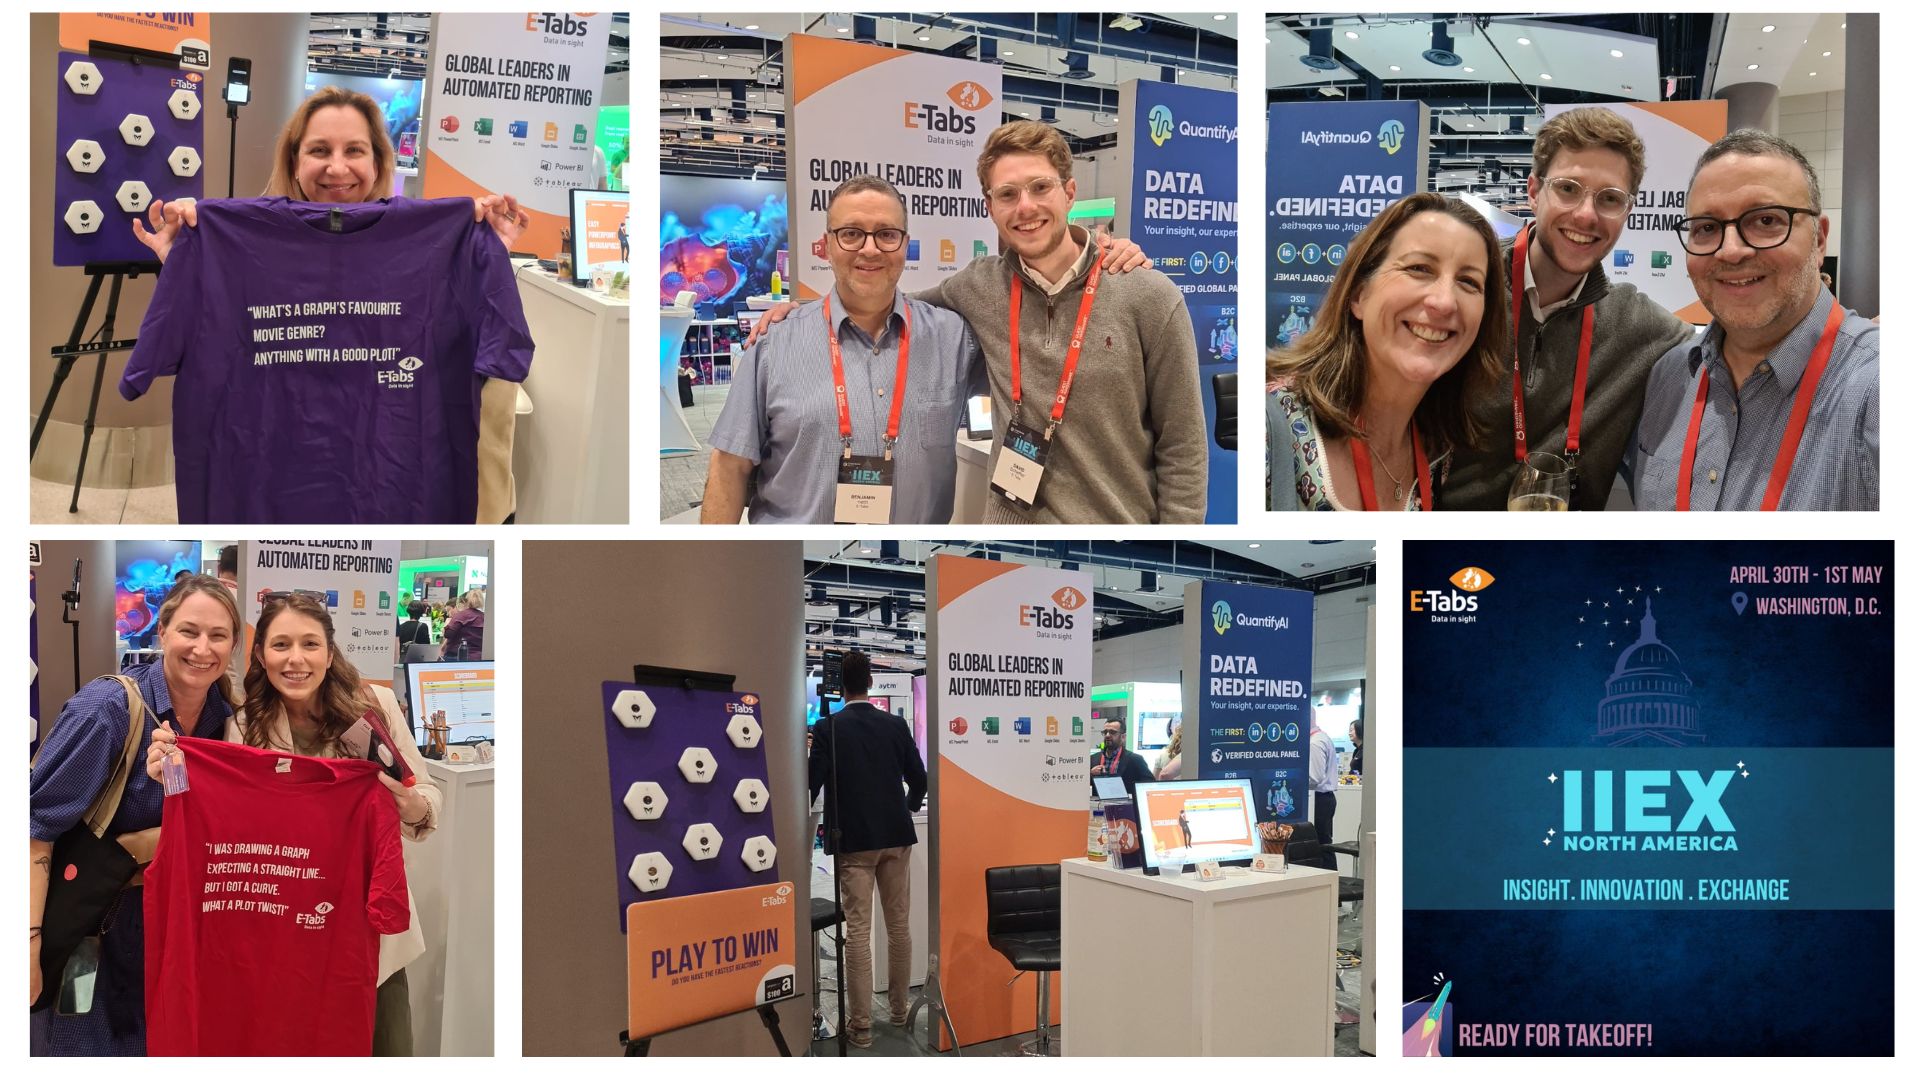
IIEX NA Was A Blast!
We had a fabulous time jetting off to Washington for Greenbook’s IIEX NA this past week! It was amazing to meet so many of you, both familiar faces and new connections and to dive into great conversations …
