NEWS, EVENTS, & CASE STUDIES
Find our latest blog posts, webinars and upcoming events here!

Webinar – SlideCraft: Charting in 60 Seconds
Join us as we introduce the next generation of E-Tabs SlideCraft! SlideCraft is a powerful Cloud-based platform that will turn any set of existing banner tables into a fully populated, editable PowerPoint de…

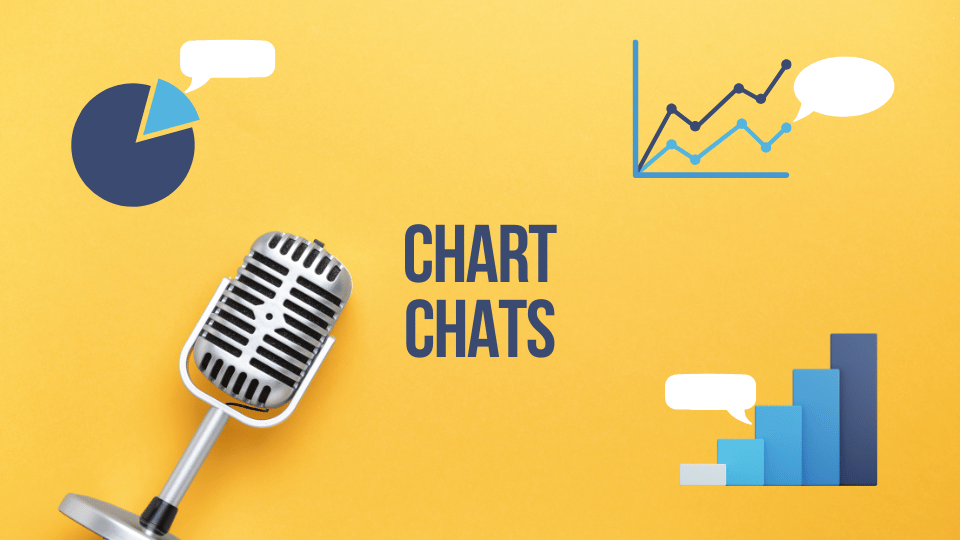
Chart Chats: Inside the World of Data’s Greatest…
Welcome to “Chart Chats”, the ultimate gathering of data’s finest emissaries! In this series, we’ll get to the heart of different chart styles to better understand how they tick, through intimate and humorous …

Breaking Down Barriers: Overcoming Challenges in T…
Overcoming the challenges of Traditional Charting As organisations look to increase efficiencies and streamline workflows, traditional charting processes are often both the cornerstone and the stumbling blo…

Webinar: Turbocharge Your PowerPoint Charting
Ad-Hoc Project Reporting at Lightning Speed! Register HERE Date: Thursday 11th July 2024 I Time: 11AM ET, 4PM BST Presenter: Benjamin Rietti, CEO, E-Tabs For many …