NEWS, EVENTS, & CASE STUDIES
Find our latest blog posts, webinars and upcoming events here!
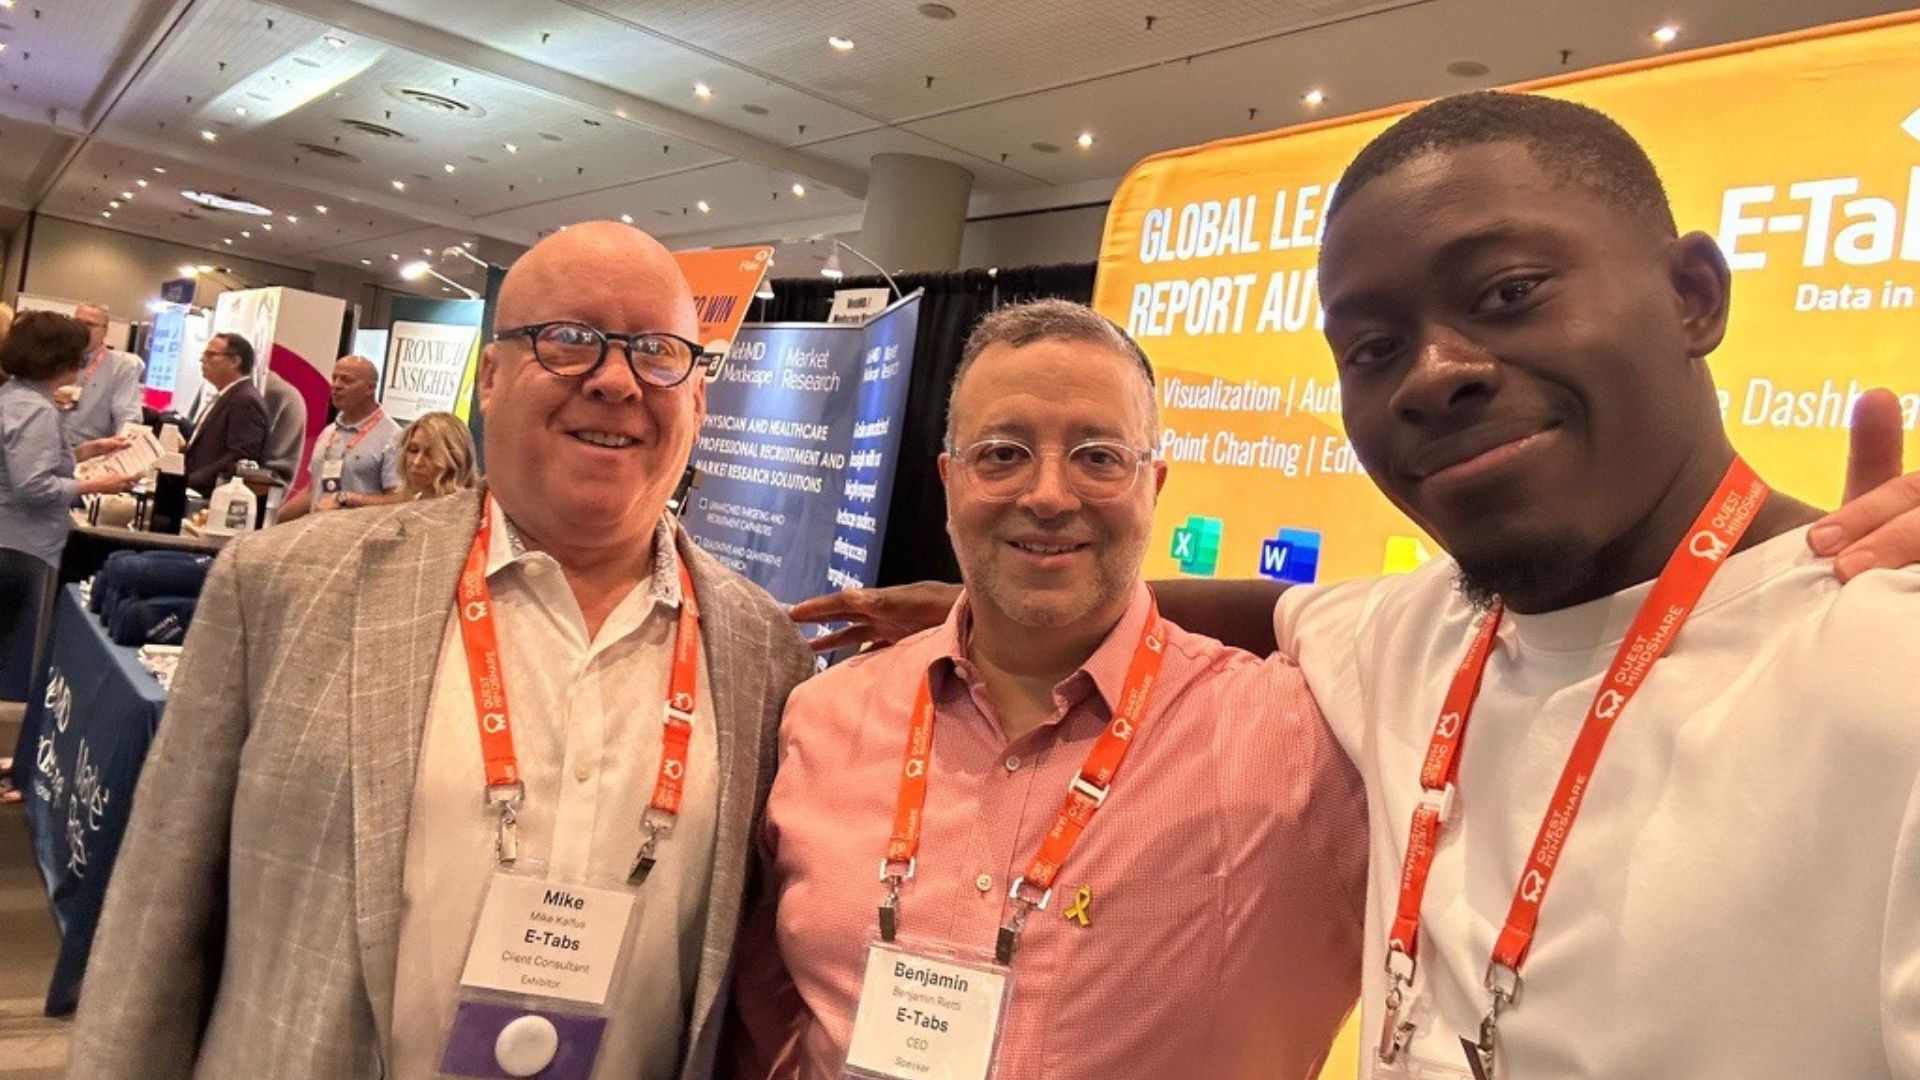
Our Time at Quirk’s NY 2024!
We Had a Blast at Quirk’s! We had a fantastic time exhibiting and presenting at the Quirk’s New York event last week! Our team, from both our London and US offices, came together to engage with attendees an…

Breaking Down Barriers: Overcoming Challenges in T…
Overcoming the challenges of Traditional Charting As organisations look to increase efficiencies and streamline workflows, traditional charting processes are often both the cornerstone and the stumbling blo…
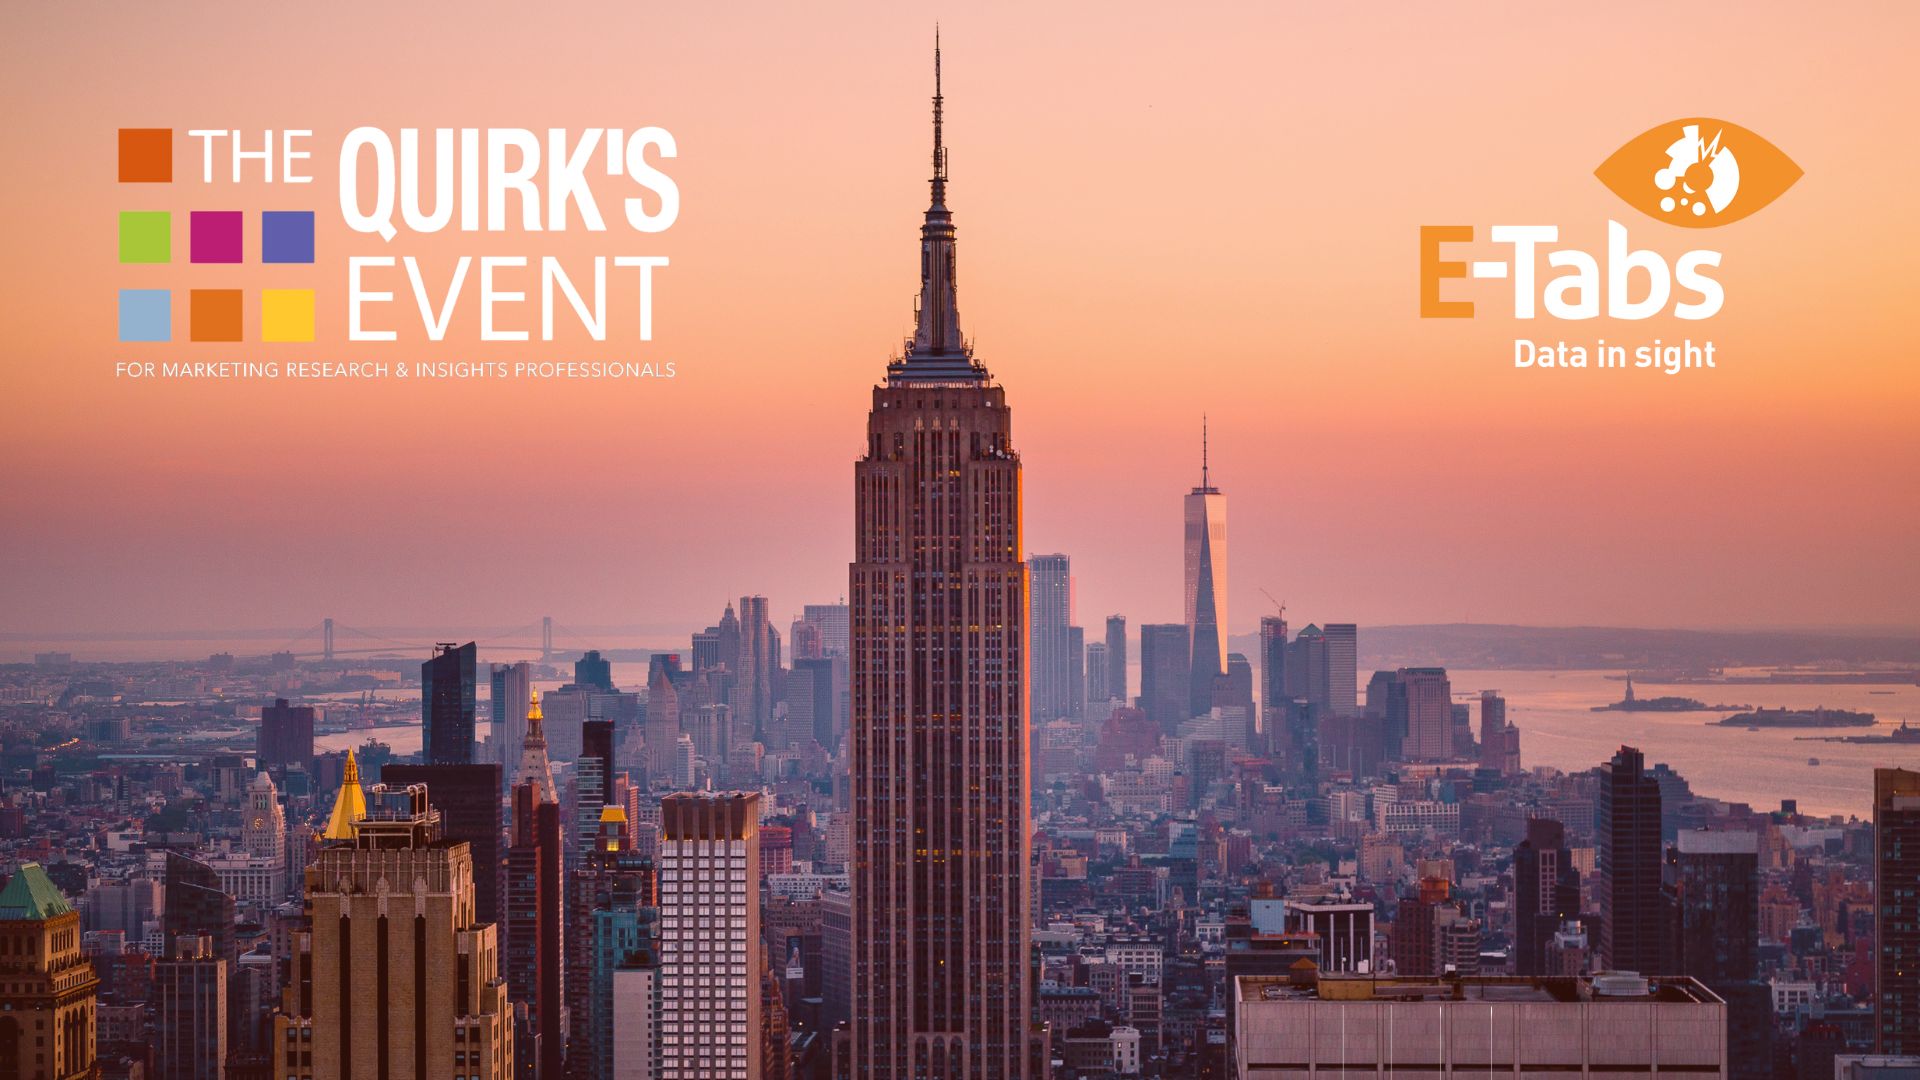
Quirk’s New York… Here We Come!
Come and Talk To Us at Booth 411! We’re excited to announce that we’ll be exhibiting and presenting at Quirk’s New York on July 17-18! The event will be held at the Javits Convention Center over t…
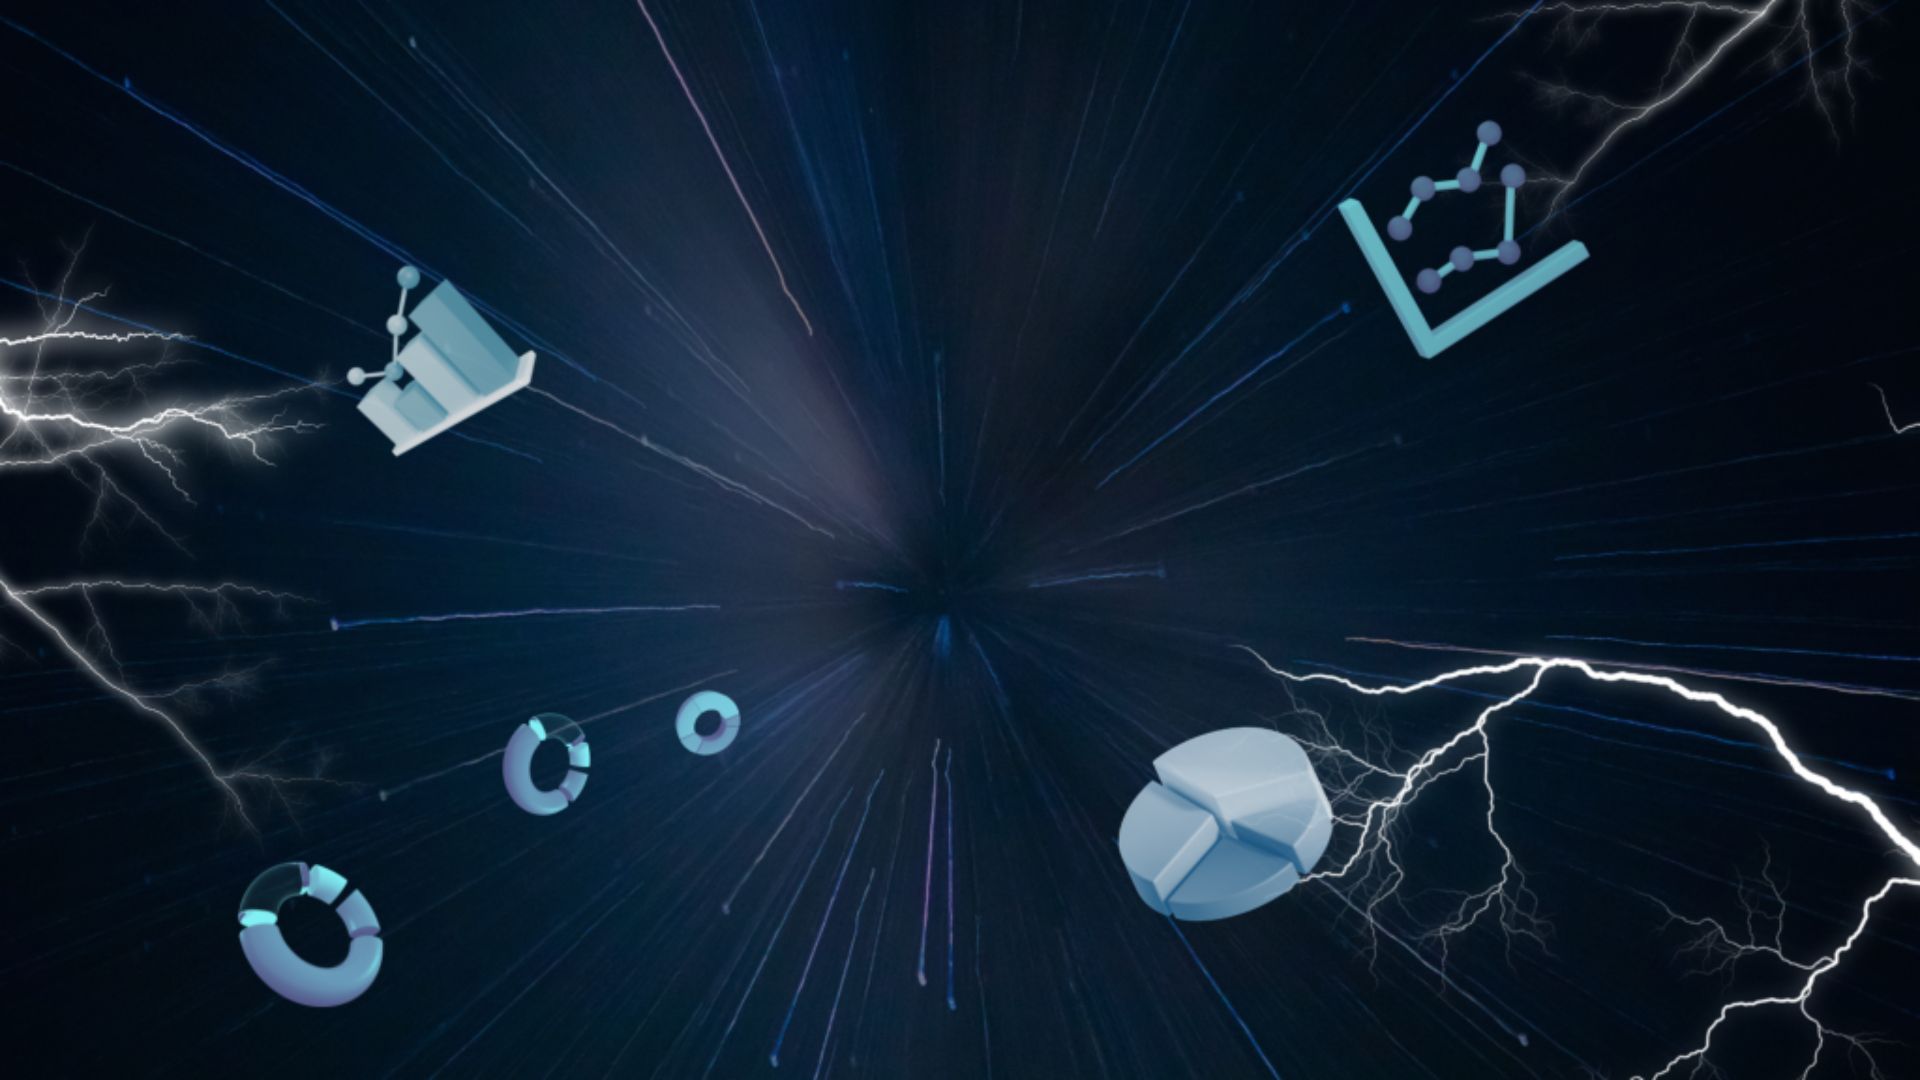
Webinar: Turbocharge Your PowerPoint Charting
Ad-Hoc Project Reporting at Lightning Speed! Register HERE Date: Thursday 11th July 2024 I Time: 11AM ET, 4PM BST Presenter: Benjamin Rietti, CEO, E-Tabs For many …
