NEWS, EVENTS, & CASE STUDIES
Find our latest blog posts, webinars and upcoming events here!
Webinar: Automating Google Slides/Sheets Reports
Secure your spot here! Date: Tuesday, 24th September | Time: 4:00PM – 4:30PM BST Are you facing client pressure to deliver reports in Google Slides or Sheets? E-Tabs presents the onl…
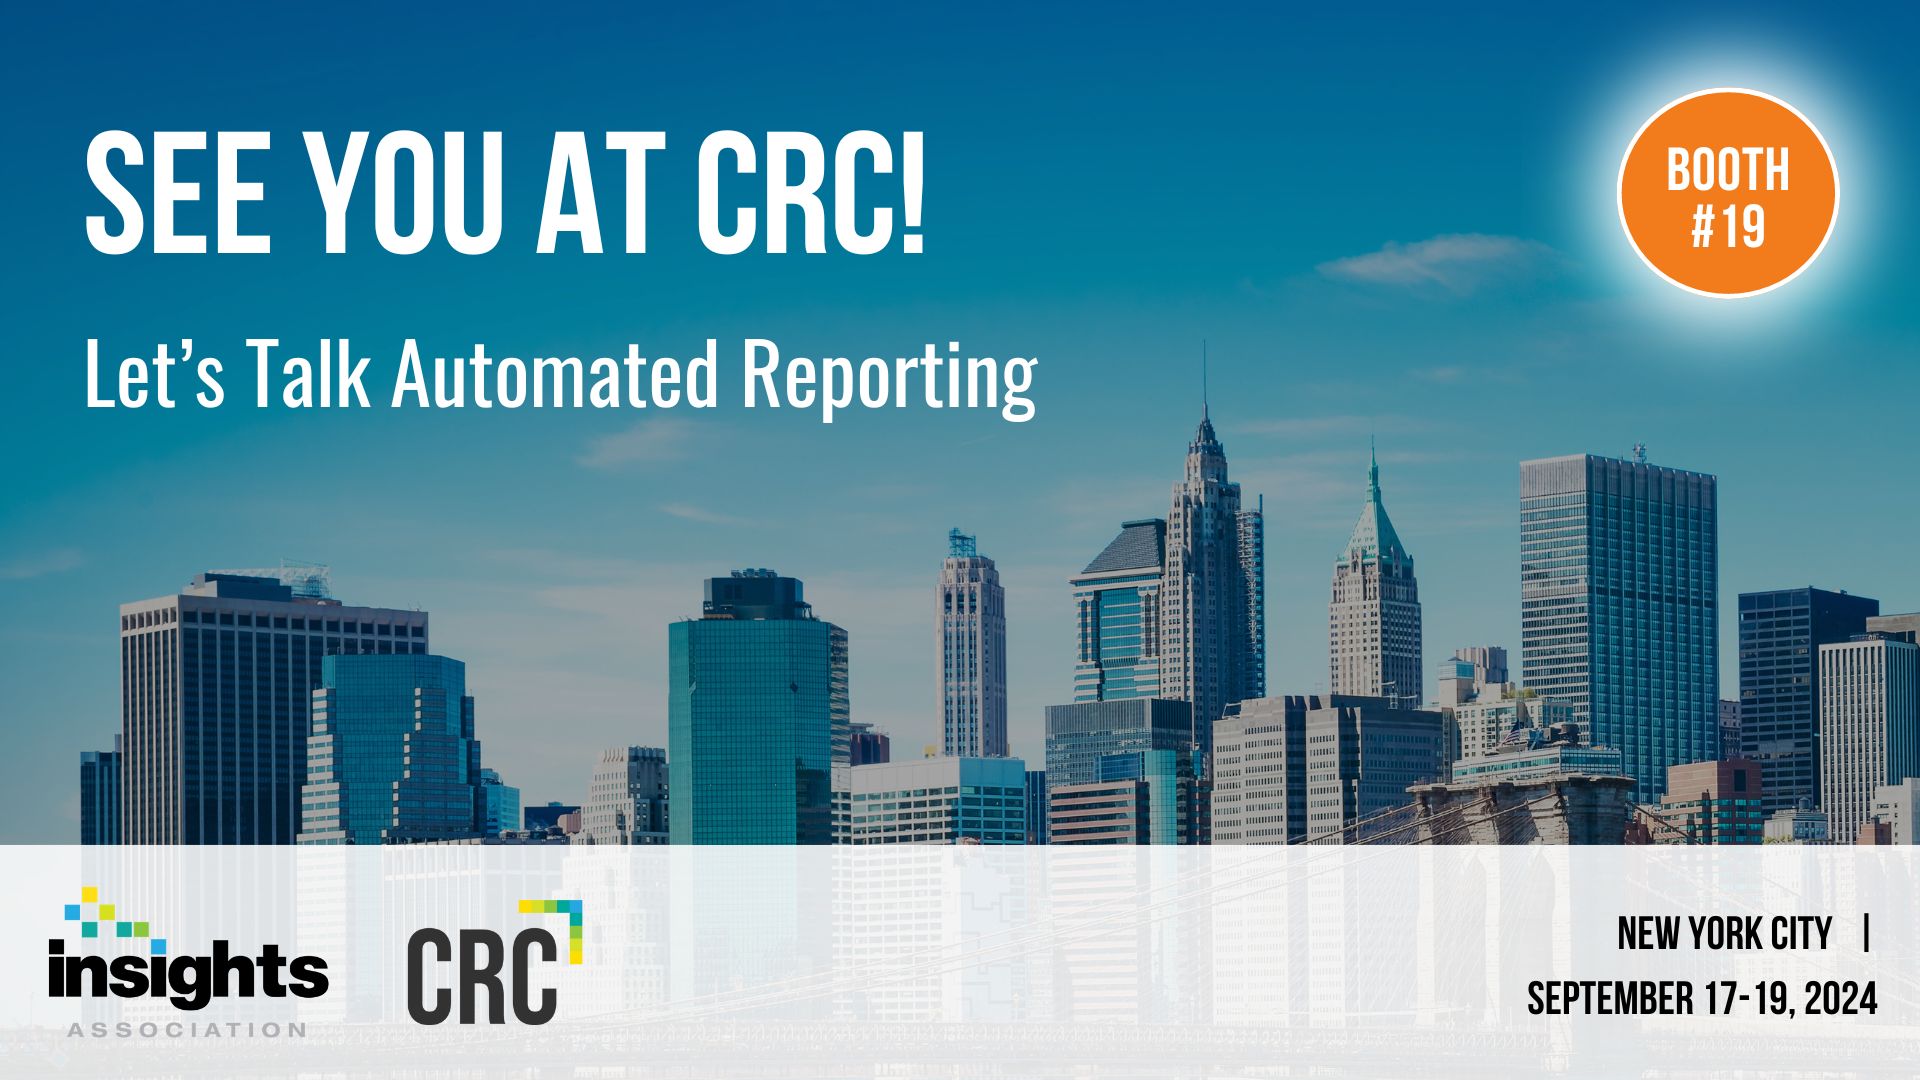
See You at the Insights Association CRC
We’re thrilled to announce our participation in this year’s Corporate Researchers Conference hosted by the Insights Association in the concrete jungle of New York from September 17-19! Don’t miss this o…
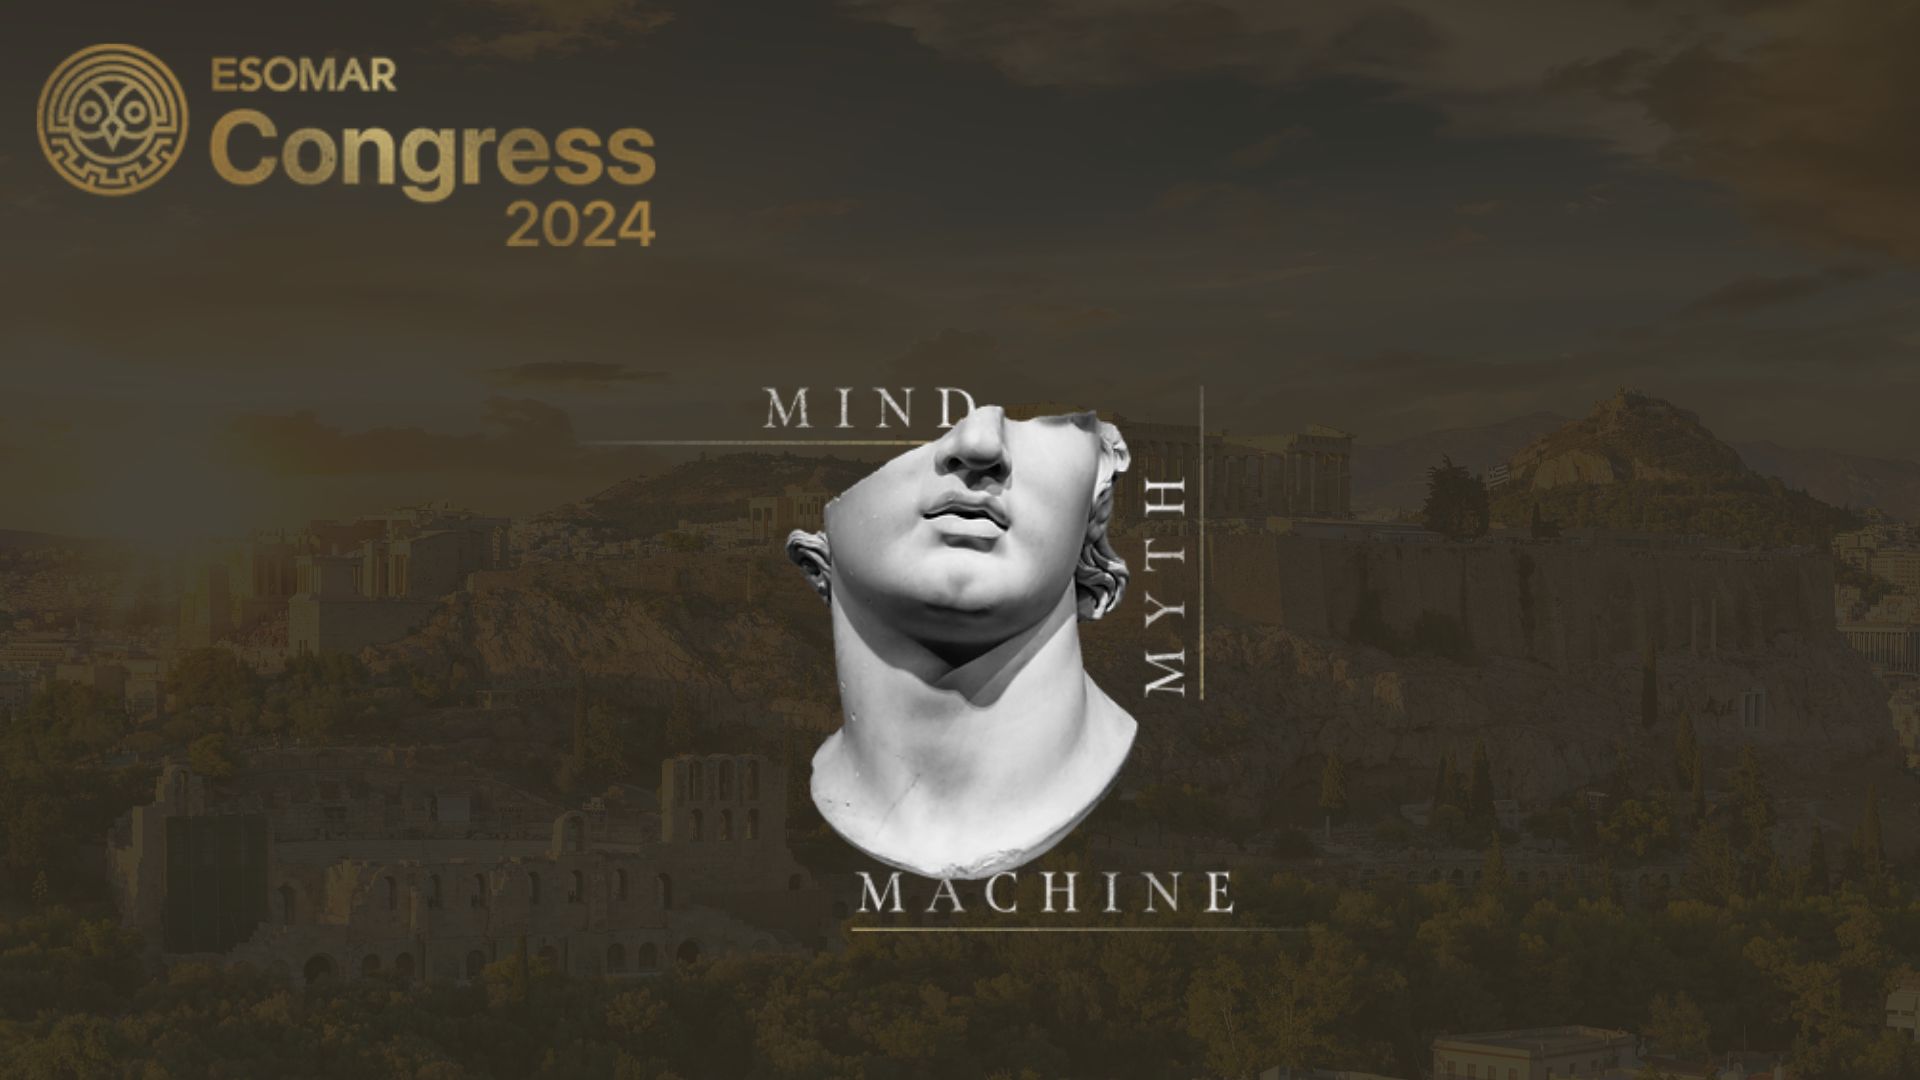
We’re Exhibiting at the Esomar Congress in A…
We’re excited to be exhibiting at the ESOMAR Congress in the beautiful city of Athens, Greece this September 8-11! It will be an eventful four days, where ancient history meets modern innovation! We will be…
Illuminas’ journey to report automation
In this article, we will explore Illuminas’ approach to successfully implement automation into their reporting processes. Illuminas are a full-service, research consultancy dedicated to delivering strate…
