Every section of the EMF has an Item field. Only a numeric value can be entered into this field (no text). This number is then assigned to an external data file. This number acts as a reference throughout Enterprise.
In the Source tab, each item number must be unique. In other words, the user cannot have duplicate item numbers. If a user tries to type an item number already in use, then the word "Source" will not appear in the grey left column. Only when "Source" appears is the item number valid.
If a user tries to duplicate or paste an item number that already exists, then the following message will appear.
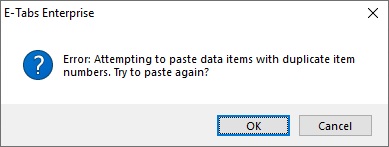
By clicking OK, the user will be brought back to the Item Number Paste Tool. The user can then select a different item number not in use. By clicking Cancel, this will close the message box and the items will not be pasted.
The value field is where the location of the external data file is identified.
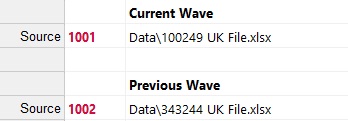
If the user leaves the item field blank and types into the value field, this will create a comment. Comments are useful for identifying the items and purpose.
For example, in the image below. A user can identify quickly which file is the current and previous wave.
If the user presses the "F1" key in the value field a Windows Explorer "Open file" box will pop up (below image).
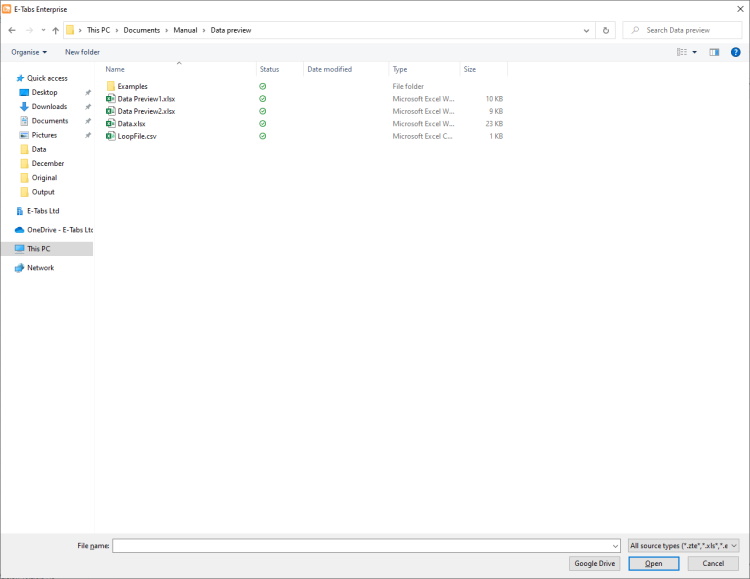
By default, the "Open file" box will display the contents of the project folder. From here the user may select data files from other locations.
Data files
Only certain data files qualify as an Enterprise Source. These are the following:
| 1) | E-Tabs generated formats: |
| a) | .zte |
| b) | .bte |
| c) | .ite |
| d) | .exl |
2) XML/SPSS files:
| a) | .mtd |
| b) | .xml |
| c) | .xte |
| d) | .sav |
3) Microsoft Excel:
| a) | .xlsx |
| b) | .csv |
| c) | .xls (we recommend updating this file to .xlsx or .exl) |
4) Google Sheets - if the user presses the Google Drive button, they can browse through their Google Drive for a Google Sheets file.
The user may select multiple data files within the same location by holding down the Ctrl or Shift keys.
Users can go up a folder from the project folder without including the full path if they wish. with the reference ..\ - An example might be ..\Data\Wave 5.xlsx
Microsoft Excel as a source file
Microsoft Excel is the preferred source file format used in E-Tabs Enterprise. Once an Excel source file has been added, the next stage is to format the file in an Enterprise friendly format. If the tables are in a consistent format, it is recommend to use Table Layouts (Click here for information on Table Layouts). The Table Layout process, will generate a table of contents, so that your tables can be located by a reference (Normally question text). Within each table a user can then reference a cell by Banner and Stub text. Referencing data by text allows much more flexibility, especially if changes are needed to the data tables. Table Layouts is built to work with aggregated data generated from Wincross, Quantum, Uncle, SPSS, Q as well as many more.
When data tables are less consistent, Enterprise has a Constant known as Crosspoints. Crosspoints allows the user to set a table corner in an ad hoc way. The user has full flexibility in that they can reference by text or they can reference an exact cell (e.g. A1 - top left cell). Click here for information on Crosspoints.
.ZTE as a source file
ZTE files are files generated by E-Tabs Writer. E-Tabs Writer will put aggregated cross-tabs into a E-tabs Enterprise friendly format. ZTE files can also be created from text files, but there are some formatting and layout requirements in order for the conversion to be successful. Table Layouts has a lot more functionality than the original E-Tabs Writer, so we recommend users opt for Table Layouts.
Table software source file
When using a .mtd file from IBM Survey Reporter, .xml from Wincross, .xte from MarketSight or .sav from SPSS. The user will want to use the Constant RowTypes to filter out frequencies and percentages. The benefit of using these files, is that the format is already in a E-Tabs Enterprise friendly format.
.EXL as a source file
The use of .exl files is identical to the use of Excel files when creating data statements. .exl is preferable to .xls as a source, because the project will run considerably faster, and there is significantly less chance of encountering memory resource issues. With projects using embedded Excel in the template, it is essential to use .exl as the source to avoid project crashes.
Excel files can be converted to .exl format, using EXL Publisher which is included with the installation of Enterprise and can be found in C:\Program Files (x86)\E-Tabs\Enterprise\EXL Publisher.exe.
If a user has Excel or .exl source data files and they are set out in a consistent format, it is a perfect candidate for using Table Layouts. If the data files are less consistent, then it is recommend the user creates Constants using crosspoints. Table Layouts will generate a Table of Contents for the data file that is imported. This Table of Contents can be used in the Table Tab of Enterprise. Please note if there are a few tables that have a slightly different format such as summary tables, it is possible to apply a Crosspoint to a source that has a Table Layout, in this case the table corner can be adjusted.
Example of use
|
|
(Download project zpg from video) |

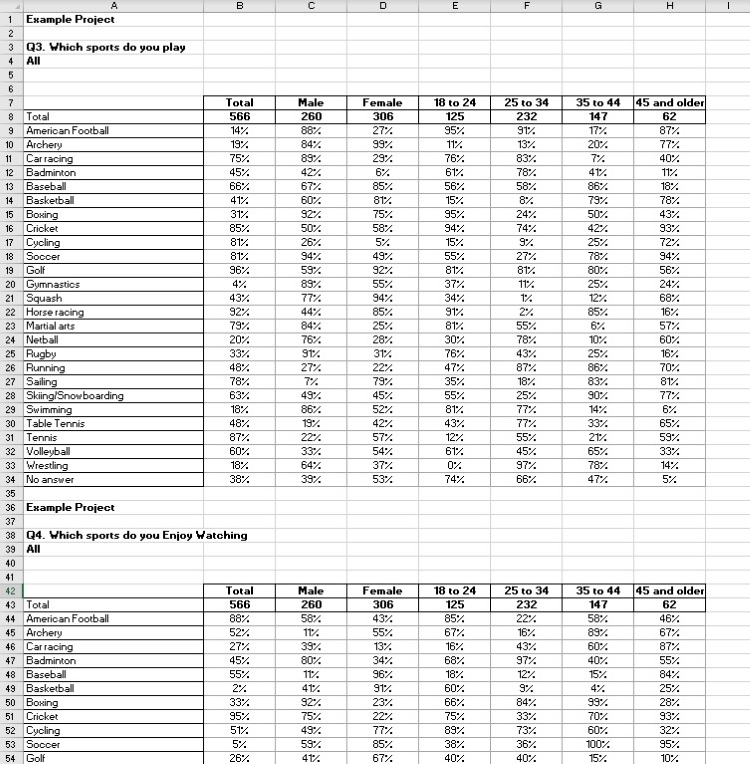
In the below image, we have an example aggregated dataset that we would like to import into the Table Layouts Wizard.
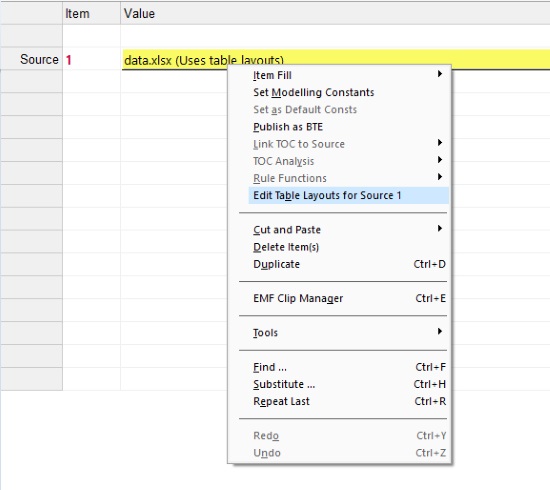
To use Table Layouts wizard go to Sources tab, select the source file for which you want to create table layouts and then right click to select "create table layouts for source n" like below:
Once selected, a window will pop up asking if you would like to Create a new layout file or edit an existing one.
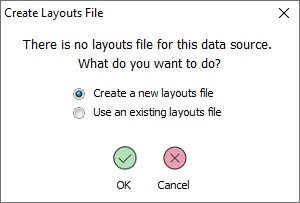
In our case we want to start afresh, so we select "Create" and click on Ok button. This will then open the Table Layouts Wizard as seen below.
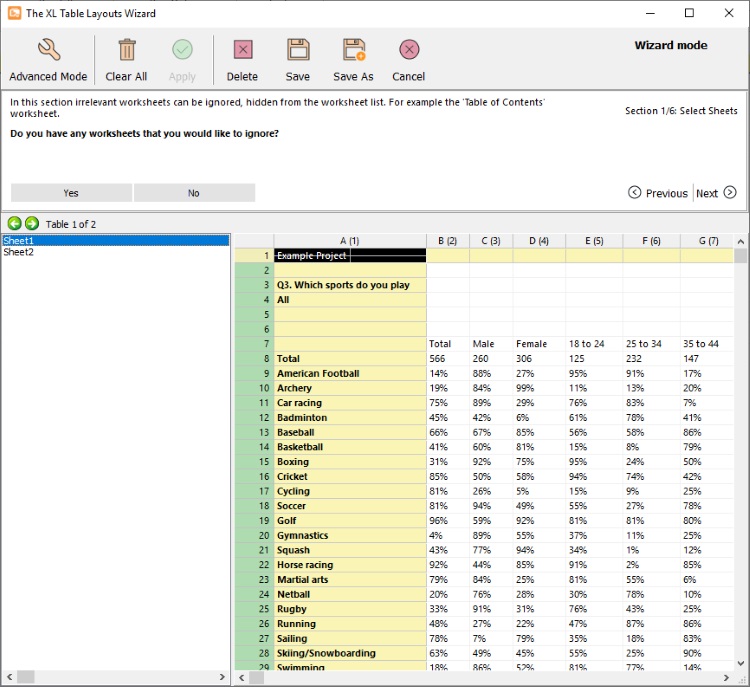
Wizard Mode
This is the default wizard the first time you open Table Layouts. The idea of this mode is to format the data tables step by step. There are 6 sections in this mode (5 sections if only a single worksheet). These sections are the tabs of the Advanced mode.
Wizard mode will ask a series of questions, as you answer each question the tables will be updated in the preview. There is a permanent previous and next button on the right hand side. The previous button will take the user back to the previous question and undo the last settings. If the user presses next it will skip the question. Alternatively, if this is the second time the user has been in Wizard mode, or if the user has made changes in the Advanced mode, these settings will be carried through the Wizard mode by pressing next.
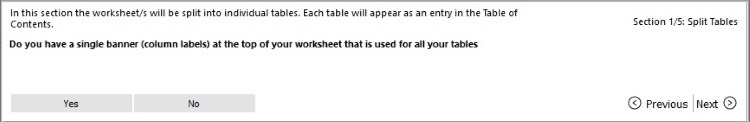
This is an example of the type of questions that will appear in wizard mode. There will always be buttons in the bottom left corner to proceed to the next question. Please note above the questions in bold, there is either an introduction into the section or a breakdown of previous answers to put the current question into context.
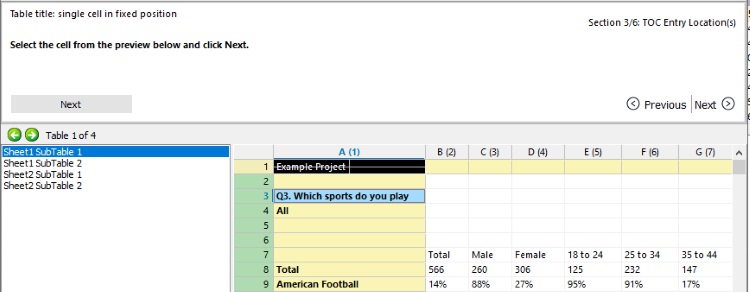
After answering some questions, you may be required to select a cell/s from the preview below. Here is an example above, where we are selecting the question text position.
Advanced Mode
This mode allows you to format your tables in any order. There are also options in this mode that are not possible in Wizard mode.
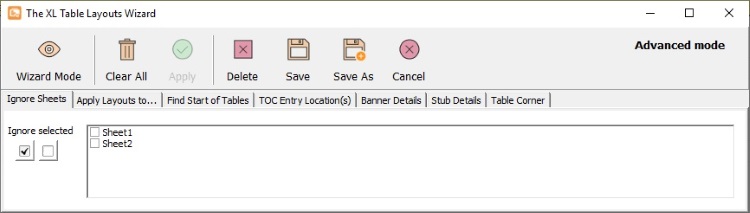
Ignore Sheets In the wizard using the first menu option you can ignore sheets for ex if there is a TOC sheet you could ignore.
Apply layouts to here the user can specify the sheets to which the Table Layouts will be applied.
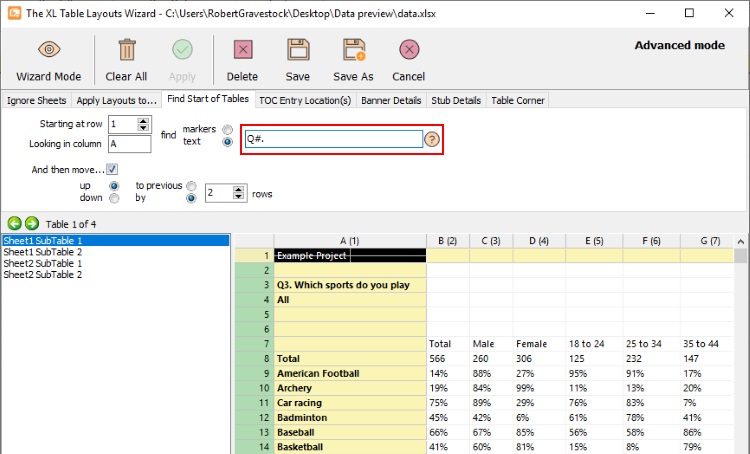
Find Start of Tables this tab defines the start point of the tables. The start of new tables will need to be identified by some consistent pattern or text. The user has the choice between using markers such as blank rows or cells (pattern) or they can specify how the text starts in a cell for each table (text). In the example below each table starts with a "Q" followed by the question number or type followed by a ".". The pattern is "Q[any number]." You can type the unique character in the text field like in our example Q then ? and a full stop. * is for any number of characters, # is for any number of numbers and ? is for one character. Now click Apply and see that the Table of contents updated in the left panel as shown below.
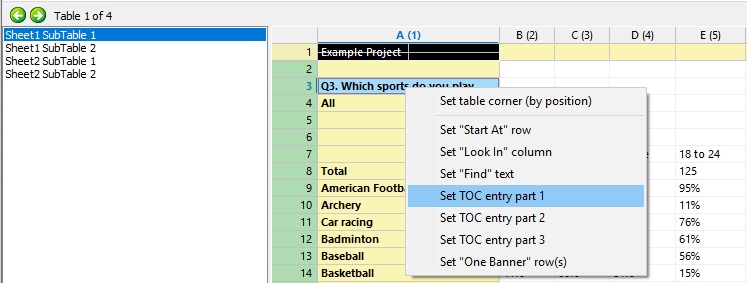
TOC Entry Location(s) The TOC entry is the text that appears in the table of contents, which then you add in to your Tables emf screen. Click on TOC Entry Location(s) and now click on the question text in the data area > Right click > TOC Entry Part 1 like below.
Click Apply and you will see that the TOC is updated with the Question texts as shown below.
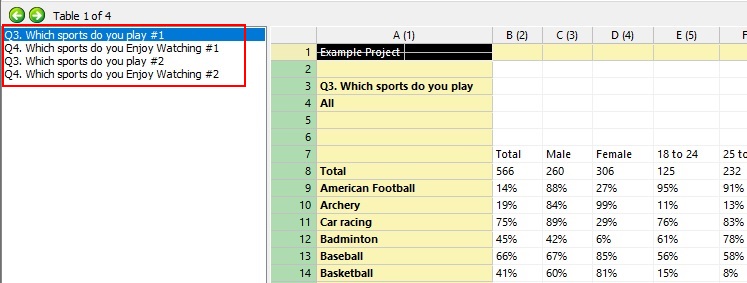
In this case there are repeat question rows, so Table Layouts automatically puts #n after each replicated TOC entry. We then have 3 options:
1) Use the #n as a reference.
2) Add additional TOC Entries, these TOC entry cells can be found in different columns.
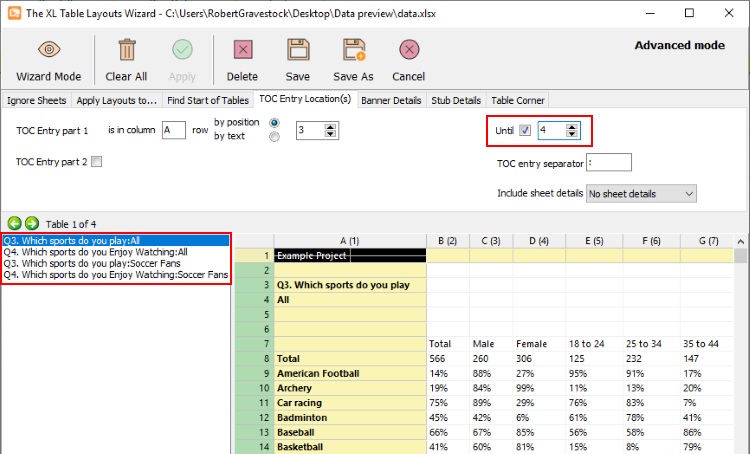
3) Use a range of cells that are all found in the same column. Until check box
In this case row 4 contains the additional information, so in the example below option 3 is used.
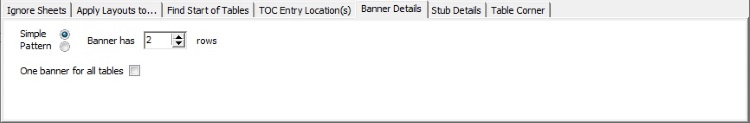
Banner Details user will set the Banner details. This step is only needed if the banner has more than one line. In our example file, the banner has no extra lines. But if you have two lines in your banner you can set your banner to two rows like this, alternatively you can select pattern and customize the banner. Please refer to the orange help button for more information. ![]()
Stub Details user will set the Stub details. This step is only needed if your stub has multiple columns. If you need your stub to be two columns or more to make them unique from each other then set the stub to two or more columns under the simple option. If you would like to customize your stub, you can do this under the pattern option. Please refer to the orange help button for more information. ![]()
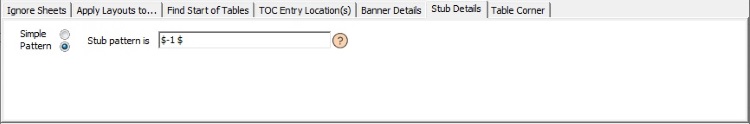
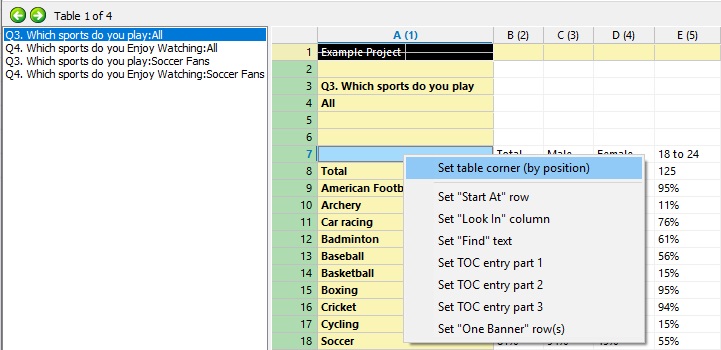
Table corner is the intersection of banner and stub. You can set the Table corner by right clicking on the cell which you think is the Table corner and clicking on Set Table corner.
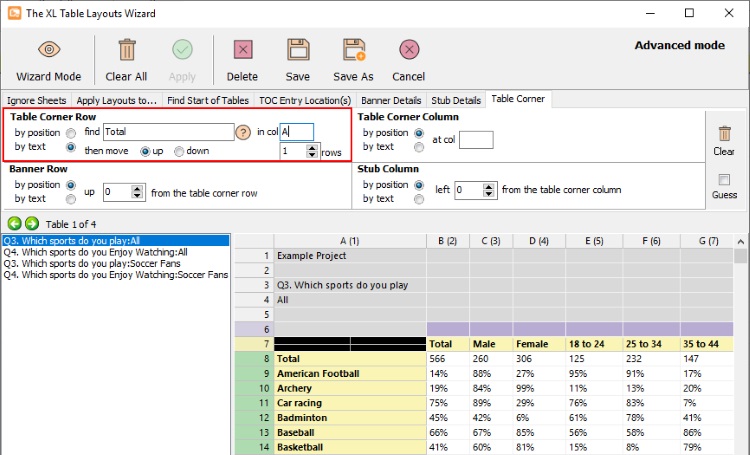
In the above example, we have used set Table corner by position. You can also set by Text like below.
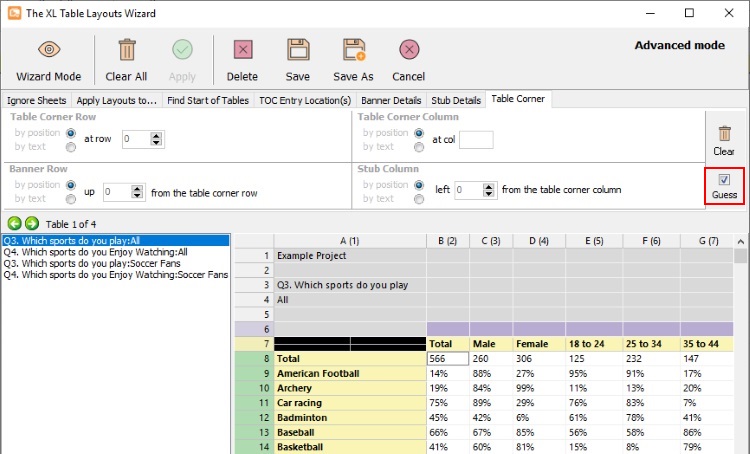
Lastly, there is the option for Table Layouts to guess the Table Corner. This can be activated on the far right. Notice that you cannot use the other Table Corner options when guessing. This feature is especially useful if you have summary tables that have a slightly different format.
Once the design has been chosen. You can select save. This will generate a text file TableLayouts.proj.txt and it will be placed inside the project folder. This save is know as save by source number. This Table Layout will always be applied to the file linked to that certain source item number.
If this type of save is not ideal for your situation. There are some other options. If you select Save as.
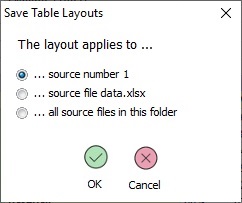
...source number n this as explained above, is the default save and the Table Layout file will be assigned to the source item number. The file produced will be called TableLayouts.proj.txt and will be placed in the project folder.
...source file <Filename.xlsx> this will save the layout file to a specific file. In this case the file is called Data.xlsx. So the Layout folder will be placed in the same folder as the data and called Data.xlsx.layouts.txt.
...all source files in this folder this will create one layout file, and it will be applied to every data file of the same format (e.g. xlsx) in the folder. An example of use may be in a multi-country project and you have a number of country data files that all share the same layout, rather than creating a layout for each. When a layout file is produced a file called TableLayouts.xlsx.txt will be placed in the folder.
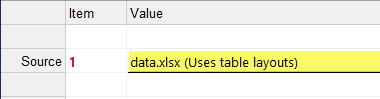
When a layout file has been applied to a data file, it can be seen within the Source tab. Notice your source file now reads that it (Uses table layouts) as shown below.
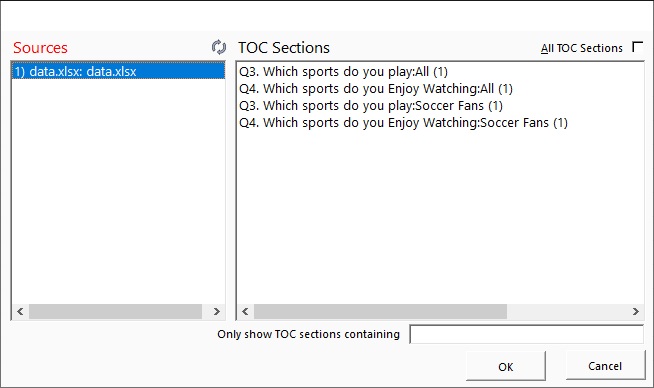
The final step is to add your newly created Tables to the Tables EMF screen. You would add by typing in an item number in Item column of the Tables screen and then in the Value column press F1 which opens up the window for you to select the source file and then check All TOC sections to add all four tables and then click ok. This will add all the four tables to your Tables screen.
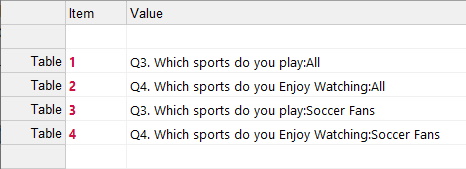
By adding all TOCs it would result in the below:
If a user browses for a .sav file and opens within the source tab, Enterprise will provide the following prompt message.

Example of use
|
|
(Download project zpg from video) |
Once the user presses yes, it will take them to the Cross-Tab wizard.

Export this option allows the user to export the data to .csv in an aggregated format. This is useful for checking the data. The user can select the tables they would like to export from the Table of Contents section.
Save this option saves the settings in the Table Layout. The information required is the Banner and if there is a ToC filter.
Cancel this will exit the wizard and take you back to the Sources Tab of Enterprise.
Advanced this will open a new window with 2 tabs. The first tab contains the raw data. The second tab allows users to create new variables based on Multi-response items.
File this shows the file path of the sav file.
Case count this is the number of lines in the sav file, each line is a respondent. If there is weighting set within the sav file for certain variables this will be applied automatically.

Table Variables this is a list of all the columns in the sav file. The left column is the variable name, the right column is the variable label which is often the question text. At the top of the table there is a text field to search through the variables. If the user presses the ![]() icon this will skip to each occurrence that contains the text. Please note, the sav reader will only extract category based columns.
icon this will skip to each occurrence that contains the text. Please note, the sav reader will only extract category based columns.

Value Labels this is the labels associated with each variable. If there are no labels saved in the sav file, the values will display here. Please note, all missing values are included by default.

Banner in this pane, the user should drag and drop variables to build the custom banner. Once a banner has at least one variable, the table of contents will be generated. The banner can include any number of variables.

Table of Contents this consists of the table variable labels each run with the custom banner. The number of tables is displayed in brackets (in the above example there are 81 tables).

ToC Filter the user should drag and drop the variable they would like to have all table of contents filtered by. Once this has been applied the number of tables will increase. The Original tables will end with ": All", there will then be additional tables that end in the Value labels for the filtered variable as seen below.


Statistics the user can add additional rows; Mean, Standard Error & Standard Deviation. The user can then set the decimal places for the statistic row.
Once the file is saved. When you return to the Sources Tab in Enterprise, it will be detailed what ToC Filter is used on the file (as you can insert multiple files with different ToC filters).

Caches in your project folder you may notice two new text files.
1) gridcache.txt
2) labelcache.txt
The purpose of these text files, is so that Enterprise can keep in memory the labels and data tables rather than creating from scratch each time. These files are built solely to improve speed and can be deleted. If the user changes or replaces a source file, the cache will automatically clear and start again.
When the user presses export, it will open the wizard below:

Export folder this is where the Excel file generated will be saved.
Export format this gives you the choice of CSV and XLSX. The CSV will be generated quicker, however has less options than the XLSX alternative.
One table per sheet the user can choose between having all data tables in a single sheet, one under another, or they can have one table per sheet.
Freeze Panes this will automatically freeze the stub and banner, this option is only available for "one table per sheet".
Table of contents this will insert a table of contents before the data tables. The Table of contents will contain links to the specific table as well as a "Back to TOC" in each table to return to the Table of contents.
Auto Filter this will insert a filter option in the table corner (Table corner is where the banner meets the stub). Here the user can filter row labels they want to see easier. Please note this option is only available for "one table per sheet".
Table titles the user can display the Variable name (often the question number) and/or the Variable label.
Percentage decimal places this is where the user can set how many decimals they would like the data tables to show. Please note for CSV the maximum the user can see is 2 decimal places, however the underlying value can be stored to more (e.g. when the cell is selected the formula bar will display the full number stored).
Display rows this lists all the row types within the disaggregated data file. The user can then uncheck the boxes if they do not want these rows exported.
Sorting the data tables will be sorted on the Total column. When checked the user can see another two options as seen below:

The user can set certain row labels to appear at the top (such as key brands/markets) and set specific row labels to the bottom (such as less important responses e.g. Don't know).
Formatting Currently there are 2 options. Unformatted and Steel blue. When pressing the plus icon, you can add your own customization, formatting colors/fonts etc (below).

The top field is where you assign the formatting a name. The custom format is then saved to your computer in this location Documents\E-Tabs\RawDataExportFormats\. This allows you to use the same custom format on different raw files and allows you to share the .fmt file with other Enterprise users.
Non-categorical variables the user can choose to show tables that calculate the mean score based on non categorical variables. For example, Ages, this table would provide the mean age.
Significance Testing this allows the users to include letters indicating significance. When a significance test is selected from the menu, the user can see further options as seen below:

Compare mode
1) Multi this will stat test every column against each other. The user can choose to exclude the Total column with the check-box to the right.
2) Single this will stat test the Total column against every other column.
3) Previous this will stat test the column to the left only. This is useful for wave data. The user can choose to exclude the Total column with the check-box to the right.
Significance level the user can choose from:
1) 99.9%
2) 99%
3) 95%
4) 90%
5) 80%
The letters would be indicated as capital letters if found significant.
Lower sig. level the user can then select a secondary level, based on the same list above. As well as the option for None, which means there is no secondary level. The letters would be indicated as lower case if found significant.
Separate banners this option is available for Multi & Previous compare modes. If this option is made active, it would mean that only banner groups would be tested against each other.

Looking at the example above. Male from the Gender banner would not be tested against Under 18s from the Age banner. However Under 18s from the Age banner would be tested against 18-24 and 25-34, etc because they are from the same Age banner.
Separator this field allows the user to put character/s between the data and letter. For example, a space or underscore. If this is left blank, the letter will appear directly after the number.
When a table is generated with significance, the letter will be inserted after the banner label in brackets. As seen below:

This allows user to view the raw file and create new variables.
Data Browser Tab
This tab is a grid view of the raw file. Here you can scroll through all the cases. The grey columns represent non-categorical questions and are by default excluded from the export and use in Enterprise.

There are various options.
Display the... this gives the user the option to look at the variable labels or variable value.
Find variables containing ... this allows the user to search the 2nd row of the gird (one above Case 1). If you check the box you can also search within the 1st row of the grid.

When the user enters text, the number of found items is displayed in green brackets. The user can then press the arrows to go left and right through the matching columns.
If the user clicks the variable name (1st row of grid). It will show the number of unique values in that column and the number of missing values.

Dump this button allows the user to export the raw data as a csv file.
Multi-response variables Tab
This allows the user to create a new variable based on a consistent value found in multiple questions.

The first step is to select the group of questions you would like to merge to become a new variable from the Variable List section. In the example below we have chosen methods of commuting. Hold the Ctrl key to select multiple rows in the list or the Shift key to select a block of variables.

The Multi-response items section confirms the variables you have selected.

The User variable parameters section:
Name this is the new variable name and must not contain a space.
Label this is the variable label with more information.
Values this section populates with any values found within the selected tables. In this case Yes and No was answered in all 9 questions selected above. The user must then select what value they want to base the new variable on. In the example above, the new variable will be based on the respondents that answered "Yes".
Dichotomous this is activated when the values match exactly between two or more variables. As part of this option the user can rename the old labels in the data tables.
When the user has pressed save, the old variables is removed from the wizard and the new one is added. If user selects a user built variable from the list, they can delete it and the old variables will reappear.
Please note all these updates are done within Enterprise Table Layouts and not applied to the actual raw data file.
Values and nets Tab
This allows the user to create new net values, customize value labels, label order and what is displayed.

The user will first select a variable from the categorical variable list section.
On the right hand side, in the Variable value labels section will display all the possible values.
The user can click a cell within the status column to toggle between whether they would like the row to be hidden or displayed.
The user can use the arrows on the right to rearrange the order of the values, alternatively it can be set in reverse by clicking the checkbox at the bottom.
The user can double click a cell from the Label column to rename the label.
To add a net score, the user can press the Add net button and it will open a window. The user can select the values from the "Create a net from..." section. In the example below, "Somewhat satisfied" and "Highly satisfied" are selected.

The user will need to name the new net value in the field on the right. In the example above, it is named "Satisfied (Net)".
This new value then has the status of Net and is highlighted in red.

The user can then press Delete net button to remove that specific selected net or press the Clear nets button to remove all nets created for that variable.
Please note all these updates are done within Enterprise Table Layouts and not applied to the actual raw data file.